29
/
en
AIzaSyAYiBZKx7MnpbEhh9jyipgxe19OcubqV5w
April 1, 2024
163560
Japan
JPN
true
2
1
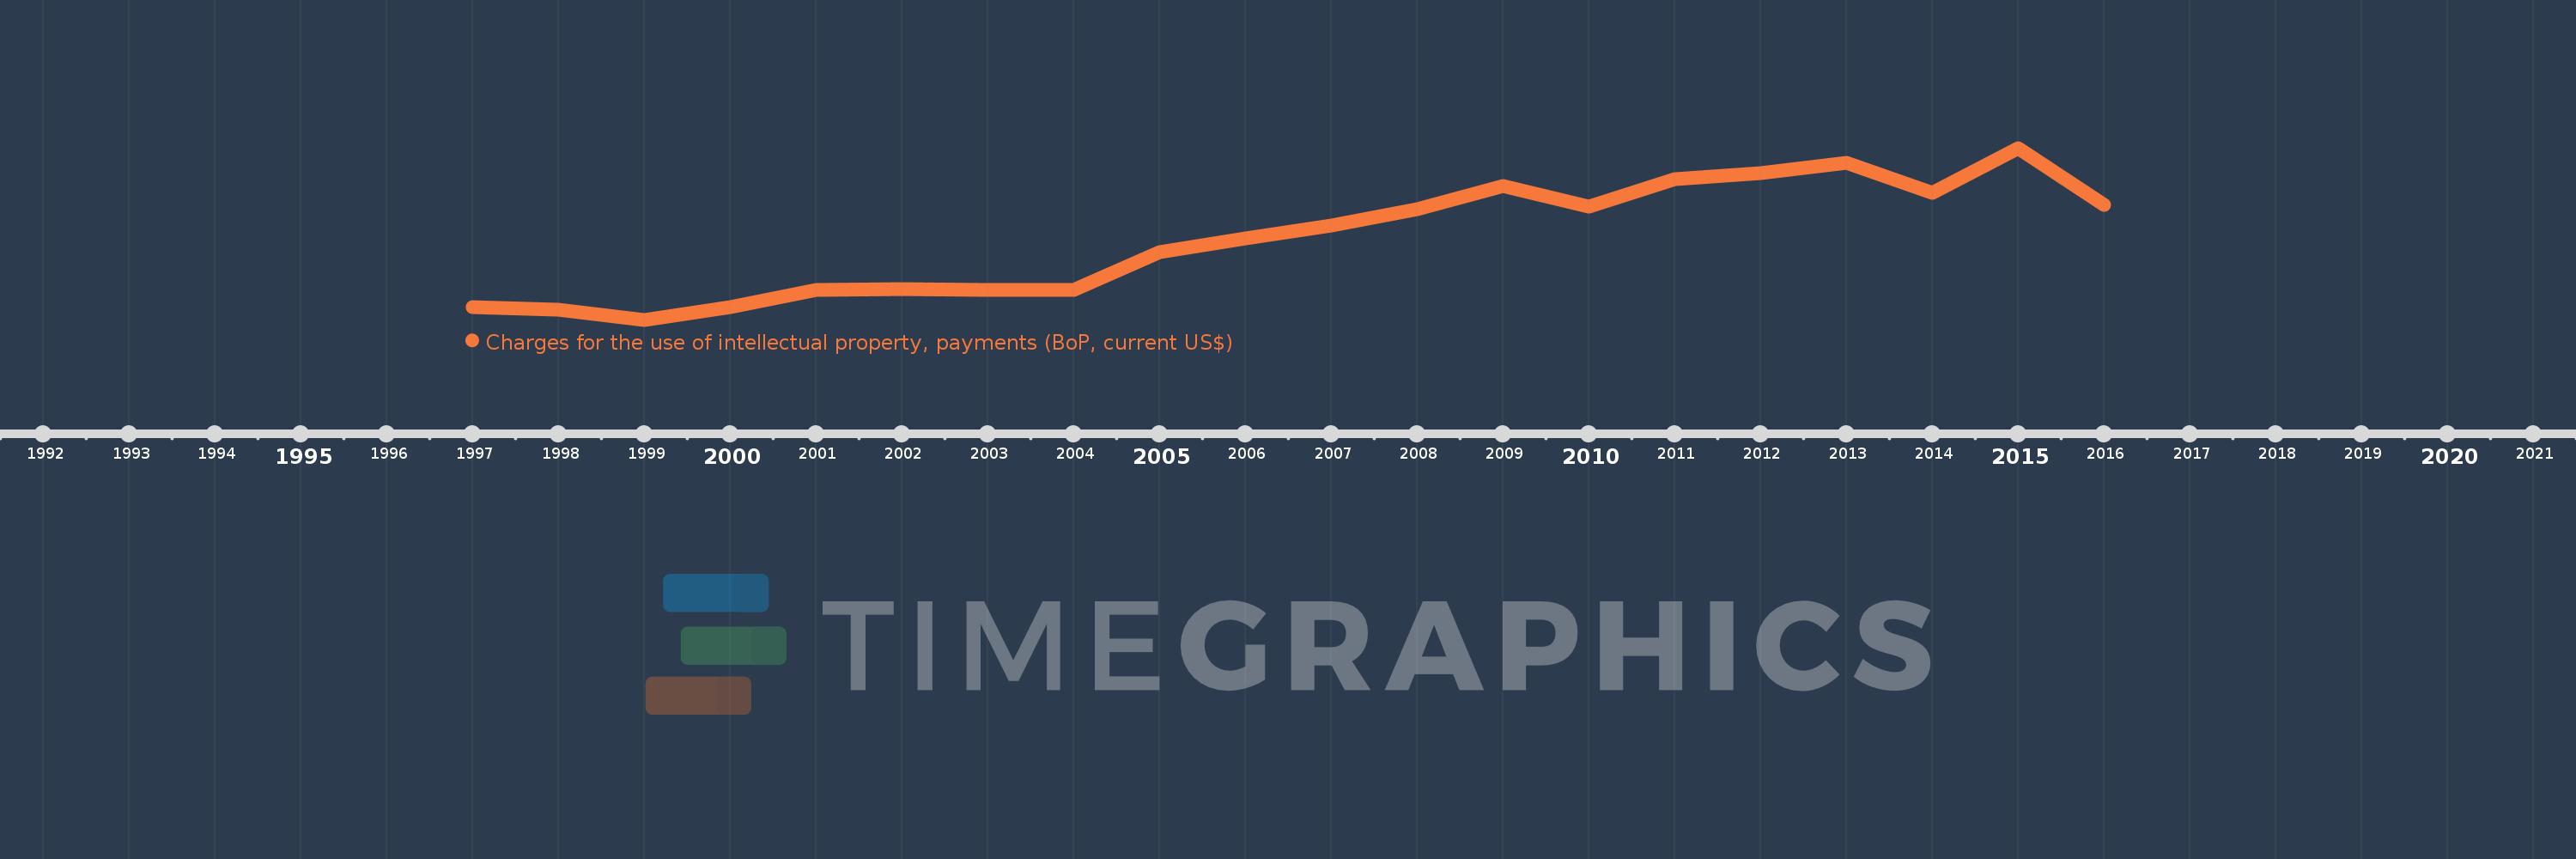
Charges for the use of intellectual property, payments (BoP, current US$)
2016,2015,2014,2013,2012,2011,2010,2009,2008,2007,2006,2005,2004,2003,2002,2001,2000,1999,1998,1997
This statistics in other country:
Timeline:
This timeline shows a graph from 1997 to 2016 of Japan. No data until 1996. Number of actual observations by date: 20.
Source name:
World Development Indicators
Source organization:
International Monetary Fund, Balance of Payments Statistics Yearbook and data files.
Categories, topics:
Economy & Growth, Science & Technology
Last updated:
apr 23, 2017
Indicators value changes by year
Minimum:
8.947 bln
jan 1, 1999
Maximum:
20.942 bln
jan 1, 2015
At the date of observation
Value
Absolute change
Change from previous value
jan 1, 1997
9.829 bln
+9.829 bln
0.0%
jan 1, 1998
9.621 bln
-208.438 mln
-2.12%
jan 1, 1999
8.947 bln
-673.127 mln
-7.0%
jan 1, 2000
9.855 bln
+907.42 mln
10.14%
jan 1, 2001
11.007 bln
+1.152 bln
11.69%
jan 1, 2002
11.099 bln
+91.769 mln
0.83%
jan 1, 2003
11.021 bln
-77.822 mln
-0.7%
jan 1, 2004
11.003 bln
-17.351 mln
-0.16%
jan 1, 2005
13.644 bln
+2.641 bln
24.0%
jan 1, 2006
14.654 bln
+1.009 bln
7.4%
jan 1, 2007
15.5 bln
+846.898 mln
5.78%
jan 1, 2008
16.678 bln
+1.177 bln
7.6%
jan 1, 2009
18.312 bln
+1.634 bln
9.8%
jan 1, 2010
16.835 bln
-1.477 bln
-8.07%
jan 1, 2011
18.769 bln
+1.934 bln
11.49%
jan 1, 2012
19.173 bln
+404.073 mln
2.15%
jan 1, 2013
19.898 bln
+724.838 mln
3.78%
jan 1, 2014
17.831 bln
-2.066 bln
-10.39%
jan 1, 2015
20.942 bln
+3.11 bln
17.44%
jan 1, 2016
16.99 bln
-3.952 bln
-18.87%
Ranking of countries by current statistics by years


Comments: