29
/
en
AIzaSyAYiBZKx7MnpbEhh9jyipgxe19OcubqV5w
April 1, 2024
205007
Namibia
NAM
true
2
1
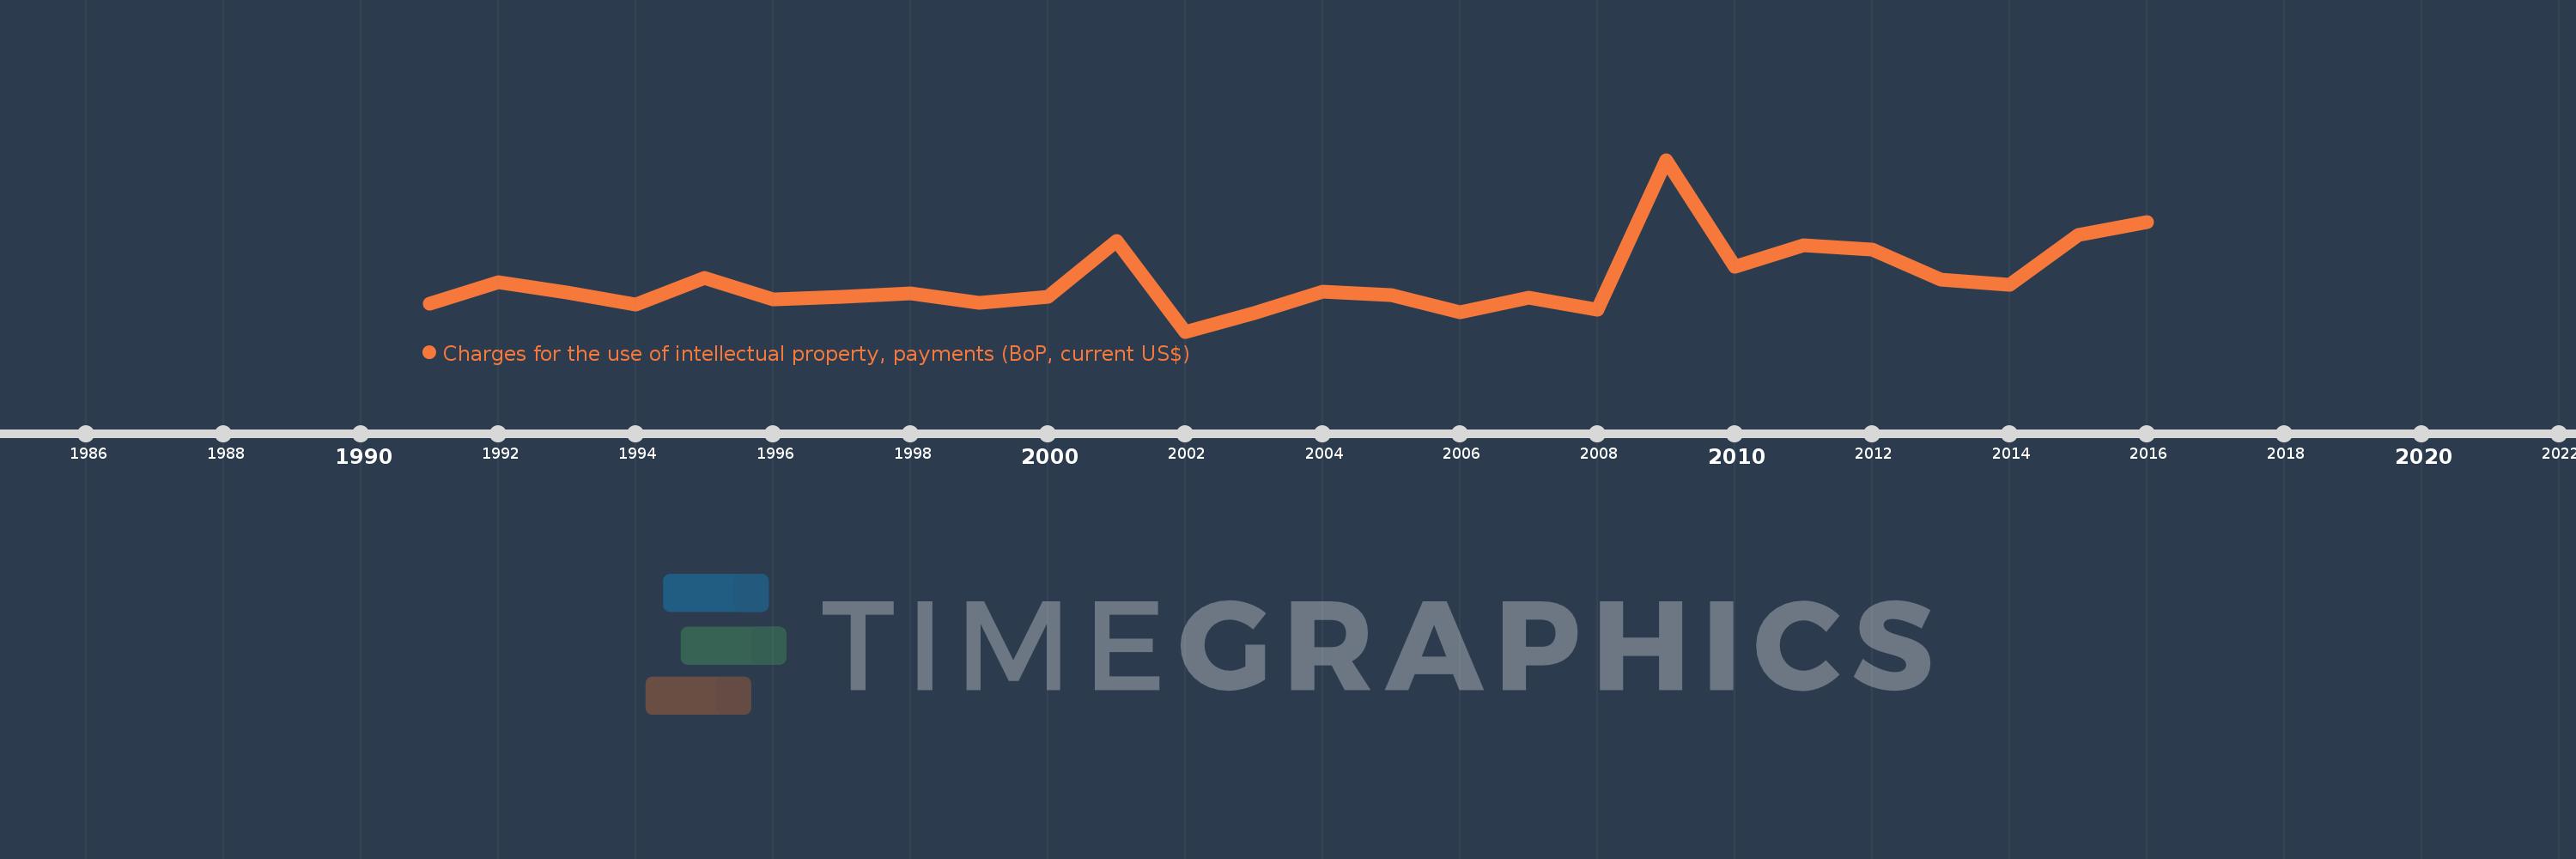
Charges for the use of intellectual property, payments (BoP, current US$)
2016,2015,2014,2013,2012,2011,2010,2009,2008,2007,2006,2005,2004,2003,2002,2001,2000,1999,1998,1997,1996,1995,1994,1993,1992,1991
This statistics in other country:
Timeline:
This timeline shows a graph from 1991 to 2016 of Namibia. No data until 1990. Number of actual observations by date: 26.
Source name:
World Development Indicators
Source organization:
International Monetary Fund, Balance of Payments Statistics Yearbook and data files.
Categories, topics:
Economy & Growth, Science & Technology
Last updated:
apr 23, 2017
Indicators value changes by year
Maximum:
15.243 mln
jan 1, 2009
At the date of observation
Value
Absolute change
Change from previous value
jan 1, 1991
2.512 mln
+2.512 mln
0.0%
jan 1, 1992
4.346 mln
+1.834 mln
72.98%
jan 1, 1993
3.471 mln
-874.525K
-20.12%
jan 1, 1994
2.387 mln
-1.084 mln
-31.24%
jan 1, 1995
4.731 mln
+2.344 mln
98.21%
jan 1, 1996
2.84 mln
-1.892 mln
-39.98%
jan 1, 1997
3.07 mln
+230.486K
8.12%
jan 1, 1998
3.429 mln
+358.616K
11.68%
jan 1, 1999
2.532 mln
-896.417K
-26.14%
jan 1, 2000
3.114 mln
+581.505K
22.96%
jan 1, 2001
8.056 mln
+4.942 mln
158.71%
jan 1, 2002
0.371
-8.056 mln
-100.0%
jan 1, 2003
1.664 mln
+1.664 mln
448.33 mln%
jan 1, 2004
3.579 mln
+1.915 mln
115.11%
jan 1, 2005
3.241 mln
-337.144K
-9.42%
jan 1, 2006
1.746 mln
-1.496 mln
-46.14%
jan 1, 2007
3.005 mln
+1.259 mln
72.11%
jan 1, 2008
1.928 mln
-1.076 mln
-35.82%
jan 1, 2009
15.243 mln
+13.315 mln
690.54%
jan 1, 2010
5.763 mln
-9.48 mln
-62.19%
jan 1, 2011
7.667 mln
+1.904 mln
33.04%
jan 1, 2012
7.298 mln
-368.913K
-4.81%
jan 1, 2013
4.626 mln
-2.673 mln
-36.62%
jan 1, 2014
4.168 mln
-457.678K
-9.89%
jan 1, 2015
8.609 mln
+4.441 mln
106.55%
jan 1, 2016
9.731 mln
+1.121 mln
13.03%
Ranking of countries by current statistics by years


Comments: