29
/
en
AIzaSyAYiBZKx7MnpbEhh9jyipgxe19OcubqV5w
April 1, 2024
43239
Latin America & the Caribbean (IDA & IBRD countries)
TLA
false
2
1
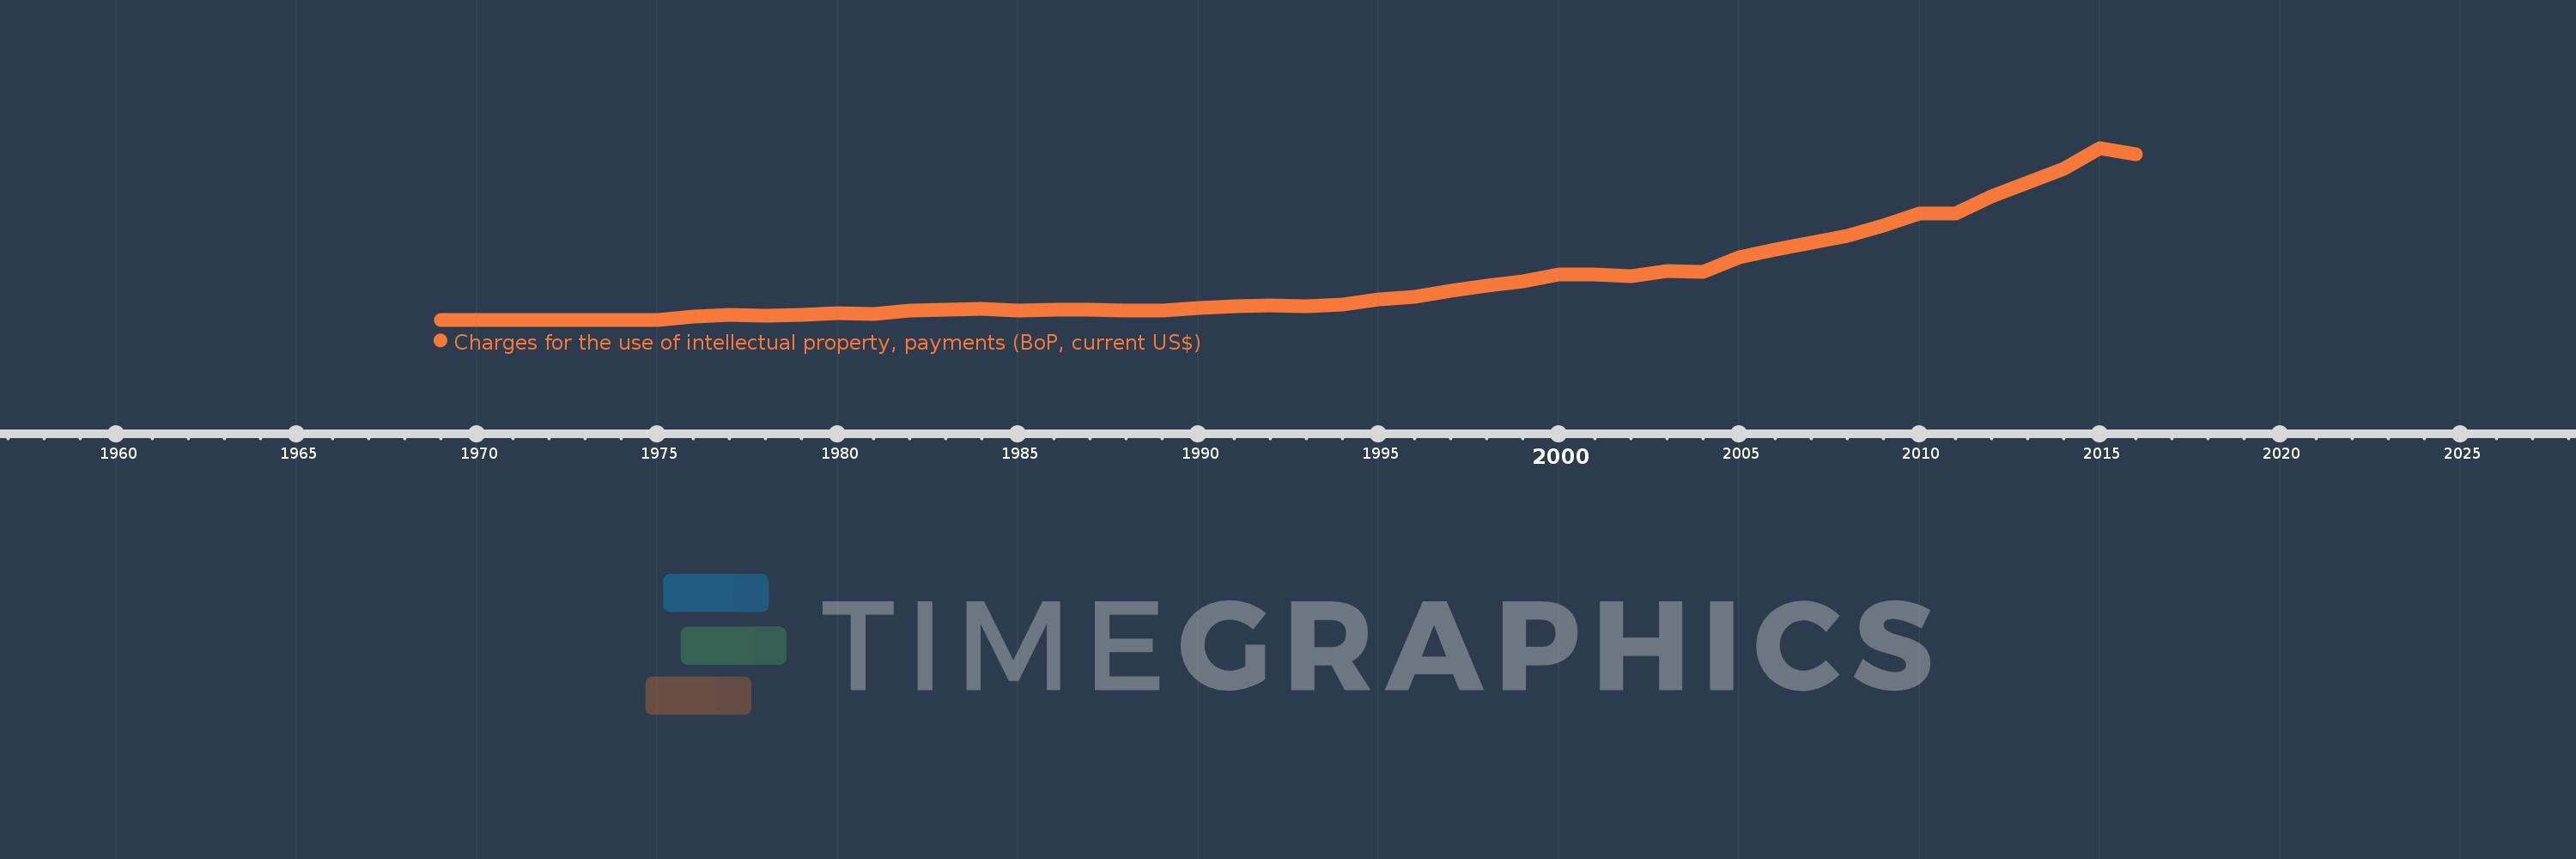
Charges for the use of intellectual property, payments (BoP, current US$)
2016,2015,2014,2013,2012,2011,2010,2009,2008,2007,2006,2005,2004,2003,2002,2001,2000,1999,1998,1997,1996,1995,1994,1993,1992,1991,1990,1989,1988,1987,1986,1985,1984,1983,1982,1981,1980,1979,1978,1977,1976,1975,1974,1973,1972,1971,1970,1969
This statistics in other country:
Timeline:
This timeline shows a graph from 1969 to 2016 of Latin America & the Caribbean (IDA & IBRD countries). No data until 1968. Number of actual observations by date: 48.
Source name:
World Development Indicators
Source organization:
International Monetary Fund, Balance of Payments Statistics Yearbook and data files.
Categories, topics:
Economy & Growth, Science & Technology
Last updated:
apr 23, 2017
Indicators value changes by year
Minimum:
1.003 mln
jan 1, 1972
Maximum:
12.533 bln
jan 1, 2015
At the date of observation
Value
Absolute change
Change from previous value
jan 1, 1969
8.0 mln
+8.0 mln
0.0%
jan 1, 1970
7.0 mln
-1000.0K
-12.5%
jan 1, 1971
10.0 mln
+3.0 mln
42.86%
jan 1, 1972
1.003 mln
-8.997 mln
-89.97%
jan 1, 1973
6.514 mln
+5.511 mln
549.49%
jan 1, 1974
8.345 mln
+1.831 mln
28.1%
jan 1, 1975
8.868 mln
+523.57K
6.27%
jan 1, 1976
236.112 mln
+227.243 mln
2.56K%
jan 1, 1977
330.943 mln
+94.831 mln
40.16%
jan 1, 1978
276.497 mln
-54.447 mln
-16.45%
jan 1, 1979
337.633 mln
+61.136 mln
22.11%
jan 1, 1980
495.275 mln
+157.642 mln
46.69%
jan 1, 1981
406.542 mln
-88.733 mln
-17.92%
jan 1, 1982
664.378 mln
+257.837 mln
63.42%
jan 1, 1983
735.545 mln
+71.167 mln
10.71%
jan 1, 1984
767.682 mln
+32.137 mln
4.37%
jan 1, 1985
695.84 mln
-71.842 mln
-9.36%
jan 1, 1986
709.417 mln
+13.577 mln
1.95%
jan 1, 1987
755.575 mln
+46.158 mln
6.51%
jan 1, 1988
694.064 mln
-61.511 mln
-8.14%
jan 1, 1989
685.703 mln
-8.361 mln
-1.2%
jan 1, 1990
828.386 mln
+142.682 mln
20.81%
jan 1, 1991
975.565 mln
+147.18 mln
17.77%
jan 1, 1992
1.04 bln
+64.628 mln
6.62%
jan 1, 1993
964.704 mln
-75.489 mln
-7.26%
jan 1, 1994
1.111 bln
+146.223 mln
15.16%
jan 1, 1995
1.495 bln
+384.422 mln
34.6%
jan 1, 1996
1.674 bln
+178.543 mln
11.94%
jan 1, 1997
2.092 bln
+418.094 mln
24.98%
jan 1, 1998
2.508 bln
+415.614 mln
19.87%
jan 1, 1999
2.784 bln
+276.824 mln
11.04%
jan 1, 2000
3.331 bln
+546.651 mln
19.63%
jan 1, 2001
3.328 bln
-2.763 mln
-0.08%
jan 1, 2002
3.167 bln
-161.017 mln
-4.84%
jan 1, 2003
3.554 bln
+386.709 mln
12.21%
jan 1, 2004
3.479 bln
-74.981 mln
-2.11%
jan 1, 2005
4.583 bln
+1.104 bln
31.73%
jan 1, 2006
5.108 bln
+524.96 mln
11.45%
jan 1, 2007
5.594 bln
+485.957 mln
9.51%
jan 1, 2008
6.147 bln
+553.296 mln
9.89%
jan 1, 2009
6.864 bln
+716.918 mln
11.66%
jan 1, 2010
7.743 bln
+879.142 mln
12.81%
jan 1, 2011
7.741 bln
-2.29 mln
-0.03%
jan 1, 2012
8.99 bln
+1.249 bln
16.14%
jan 1, 2013
10.011 bln
+1.02 bln
11.35%
jan 1, 2014
11.002 bln
+991.327 mln
9.9%
jan 1, 2015
12.533 bln
+1.531 bln
13.92%
jan 1, 2016
12.054 bln
-479.706 mln
-3.83%
Ranking of countries by current statistics by years


Comments: