29
/
en
AIzaSyAYiBZKx7MnpbEhh9jyipgxe19OcubqV5w
April 1, 2024
79248
Barbados
BRB
true
2
1
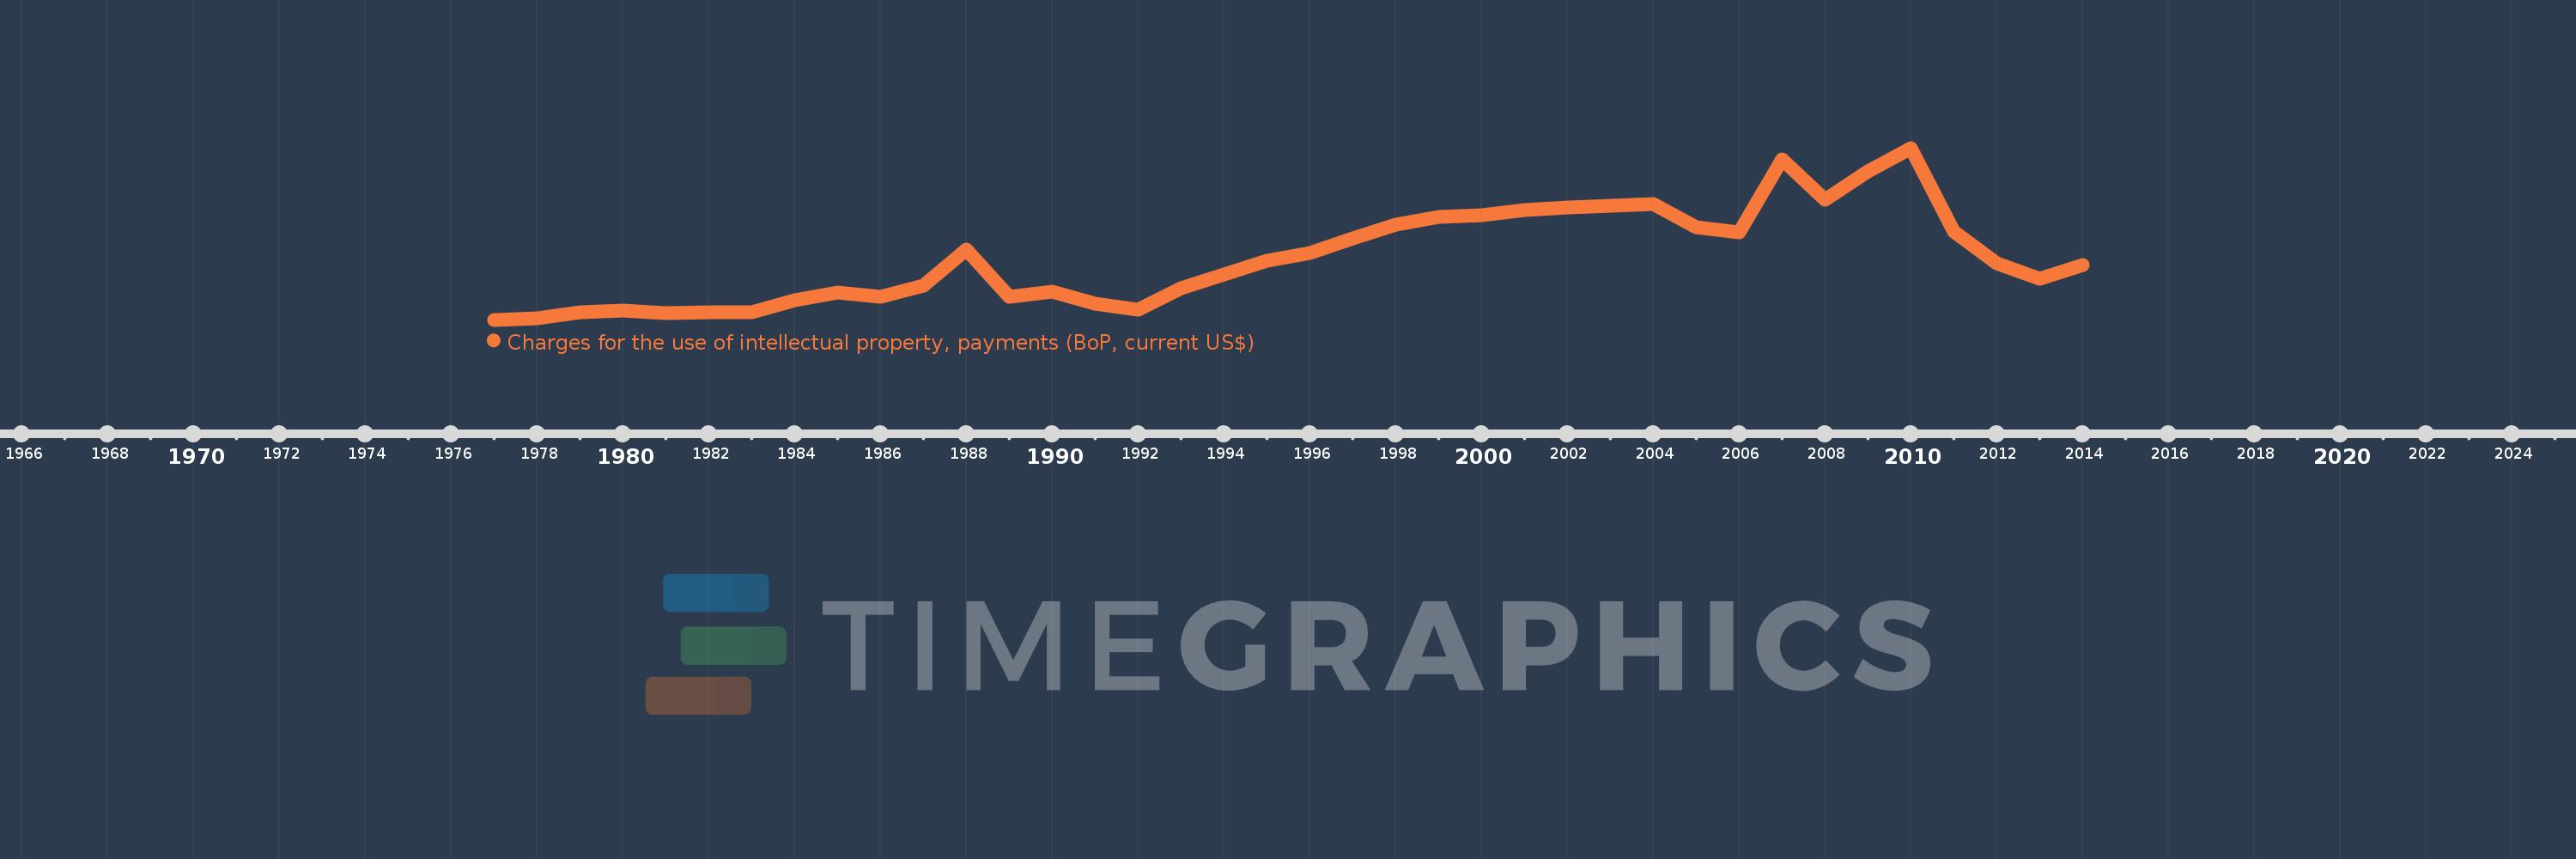
Charges for the use of intellectual property, payments (BoP, current US$)
2014,2013,2012,2011,2010,2009,2008,2007,2006,2005,2004,2003,2002,2001,2000,1999,1998,1997,1996,1995,1994,1993,1992,1991,1990,1989,1988,1987,1986,1985,1984,1983,1982,1981,1980,1979,1978,1977
This statistics in other country:
Timeline:
This timeline shows a graph from 1977 to 2014 of Barbados. No data until 1976. Number of actual observations by date: 38.
Source name:
World Development Indicators
Source organization:
International Monetary Fund, Balance of Payments Statistics Yearbook and data files.
Categories, topics:
Economy & Growth, Science & Technology
Last updated:
apr 23, 2017
Indicators value changes by year
Minimum:
600.0K
jan 1, 1977
Maximum:
36.772 mln
jan 1, 2010
At the date of observation
Value
Absolute change
Change from previous value
jan 1, 1977
600.0K
+600.0K
0.0%
jan 1, 1978
900.0K
+300.0K
50.0%
jan 1, 1979
2.1 mln
+1.2 mln
133.33%
jan 1, 1980
2.55 mln
+450.0K
21.43%
jan 1, 1981
2.05 mln
-500.0K
-19.61%
jan 1, 1982
2.2 mln
+150.0K
7.32%
jan 1, 1983
2.15 mln
-50.0K
-2.27%
jan 1, 1984
4.7 mln
+2.55 mln
118.6%
jan 1, 1985
6.4 mln
+1.7 mln
36.17%
jan 1, 1986
5.4 mln
-1000.0K
-15.63%
jan 1, 1987
7.7 mln
+2.3 mln
42.59%
jan 1, 1988
15.45 mln
+7.75 mln
100.65%
jan 1, 1989
5.5 mln
-9.95 mln
-64.4%
jan 1, 1990
6.55 mln
+1.05 mln
19.09%
jan 1, 1991
4.0 mln
-2.55 mln
-38.93%
jan 1, 1992
2.7 mln
-1.3 mln
-32.5%
jan 1, 1993
7.25 mln
+4.55 mln
168.52%
jan 1, 1994
10.15 mln
+2.9 mln
40.0%
jan 1, 1995
12.95 mln
+2.8 mln
27.59%
jan 1, 1996
14.65 mln
+1.7 mln
13.13%
jan 1, 1997
17.8 mln
+3.15 mln
21.5%
jan 1, 1998
20.65 mln
+2.85 mln
16.01%
jan 1, 1999
22.2 mln
+1.55 mln
7.51%
jan 1, 2000
22.6 mln
+400.0K
1.8%
jan 1, 2001
23.7 mln
+1.1 mln
4.87%
jan 1, 2002
24.3 mln
+600.0K
2.53%
jan 1, 2003
24.6 mln
+300.0K
1.23%
jan 1, 2004
24.95 mln
+350.0K
1.42%
jan 1, 2005
20.014 mln
-4.936 mln
-19.78%
jan 1, 2006
19.057 mln
-957.34K
-4.78%
jan 1, 2007
34.4 mln
+15.343 mln
80.51%
jan 1, 2008
25.95 mln
-8.45 mln
-24.56%
jan 1, 2009
31.8 mln
+5.85 mln
22.54%
jan 1, 2010
36.772 mln
+4.972 mln
15.63%
jan 1, 2011
19.148 mln
-17.624 mln
-47.93%
jan 1, 2012
12.426 mln
-6.722 mln
-35.11%
jan 1, 2013
9.223 mln
-3.203 mln
-25.78%
jan 1, 2014
12.138 mln
+2.915 mln
31.61%
Ranking of countries by current statistics by years


Comments: