29
/
en
AIzaSyAYiBZKx7MnpbEhh9jyipgxe19OcubqV5w
April 1, 2024
151377
Hong Kong SAR, China
HKG
true
2
1
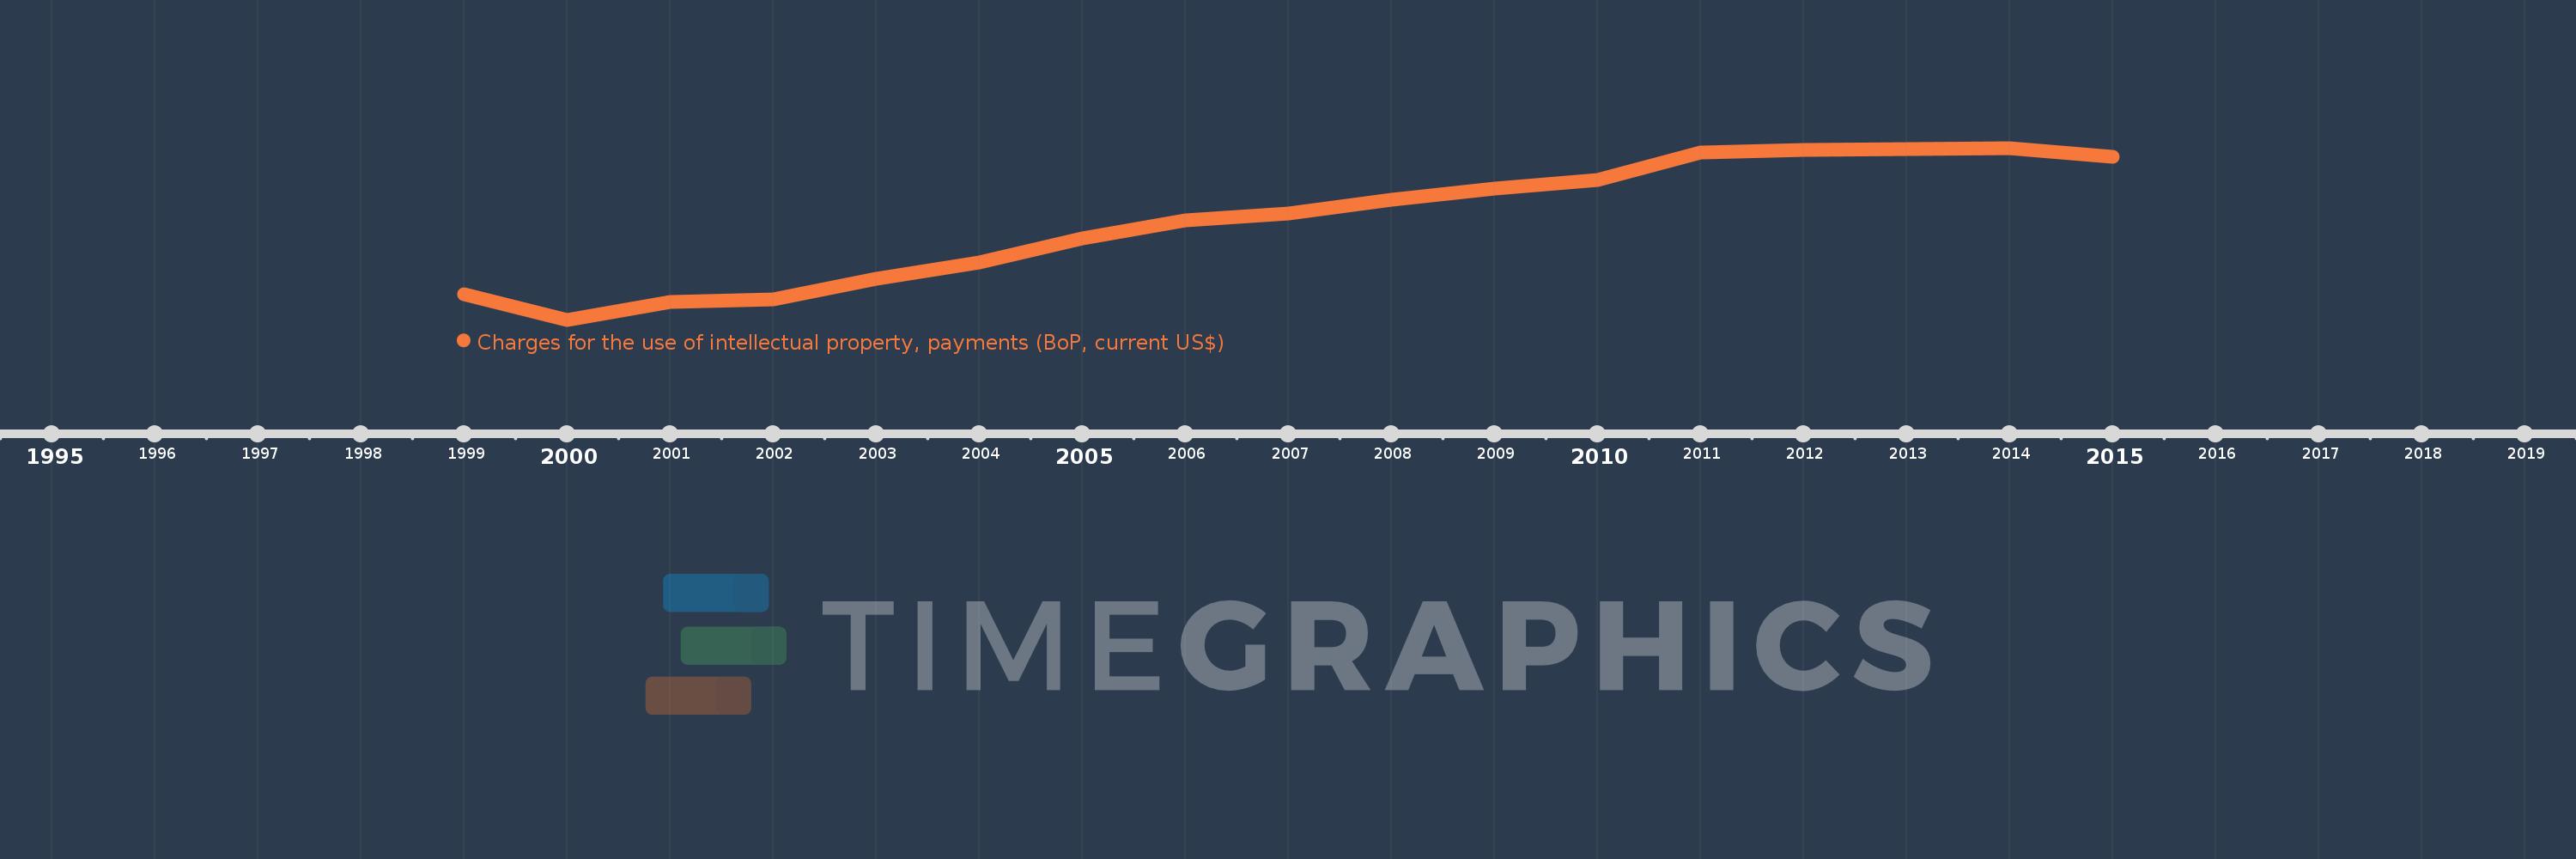
Charges for the use of intellectual property, payments (BoP, current US$)
2015,2014,2013,2012,2011,2010,2009,2008,2007,2006,2005,2004,2003,2002,2001,2000,1999
This statistics in other country:
Timeline:
This timeline shows a graph from 1999 to 2015 of Hong Kong SAR, China. No data until 1998. Number of actual observations by date: 17.
Source name:
World Development Indicators
Source organization:
International Monetary Fund, Balance of Payments Statistics Yearbook and data files.
Categories, topics:
Economy & Growth, Science & Technology
Last updated:
apr 23, 2017
Indicators value changes by year
Minimum:
280.589 mln
jan 1, 2000
Maximum:
2.027 bln
jan 1, 2014
At the date of observation
Value
Absolute change
Change from previous value
jan 1, 1999
536.839 mln
+536.839 mln
0.0%
jan 1, 2000
280.589 mln
-256.25 mln
-47.73%
jan 1, 2001
461.123 mln
+180.534 mln
64.34%
jan 1, 2002
491.103 mln
+29.98 mln
6.5%
jan 1, 2003
695.995 mln
+204.892 mln
41.72%
jan 1, 2004
864.429 mln
+168.434 mln
24.2%
jan 1, 2005
1.111 bln
+246.919 mln
28.56%
jan 1, 2006
1.289 bln
+177.465 mln
15.97%
jan 1, 2007
1.357 bln
+68.68 mln
5.33%
jan 1, 2008
1.504 bln
+146.924 mln
10.82%
jan 1, 2009
1.61 bln
+106.048 mln
7.05%
jan 1, 2010
1.7 bln
+89.288 mln
5.54%
jan 1, 2011
1.978 bln
+278.379 mln
16.38%
jan 1, 2012
2.009 bln
+31.148 mln
1.57%
jan 1, 2013
2.019 bln
+9.295 mln
0.46%
jan 1, 2014
2.027 bln
+8.592 mln
0.43%
jan 1, 2015
1.938 bln
-88.88 mln
-4.38%
Ranking of countries by current statistics by years


Comments: