29
/
en
AIzaSyAYiBZKx7MnpbEhh9jyipgxe19OcubqV5w
April 1, 2024
243397
Solomon Islands
SLB
true
2
1
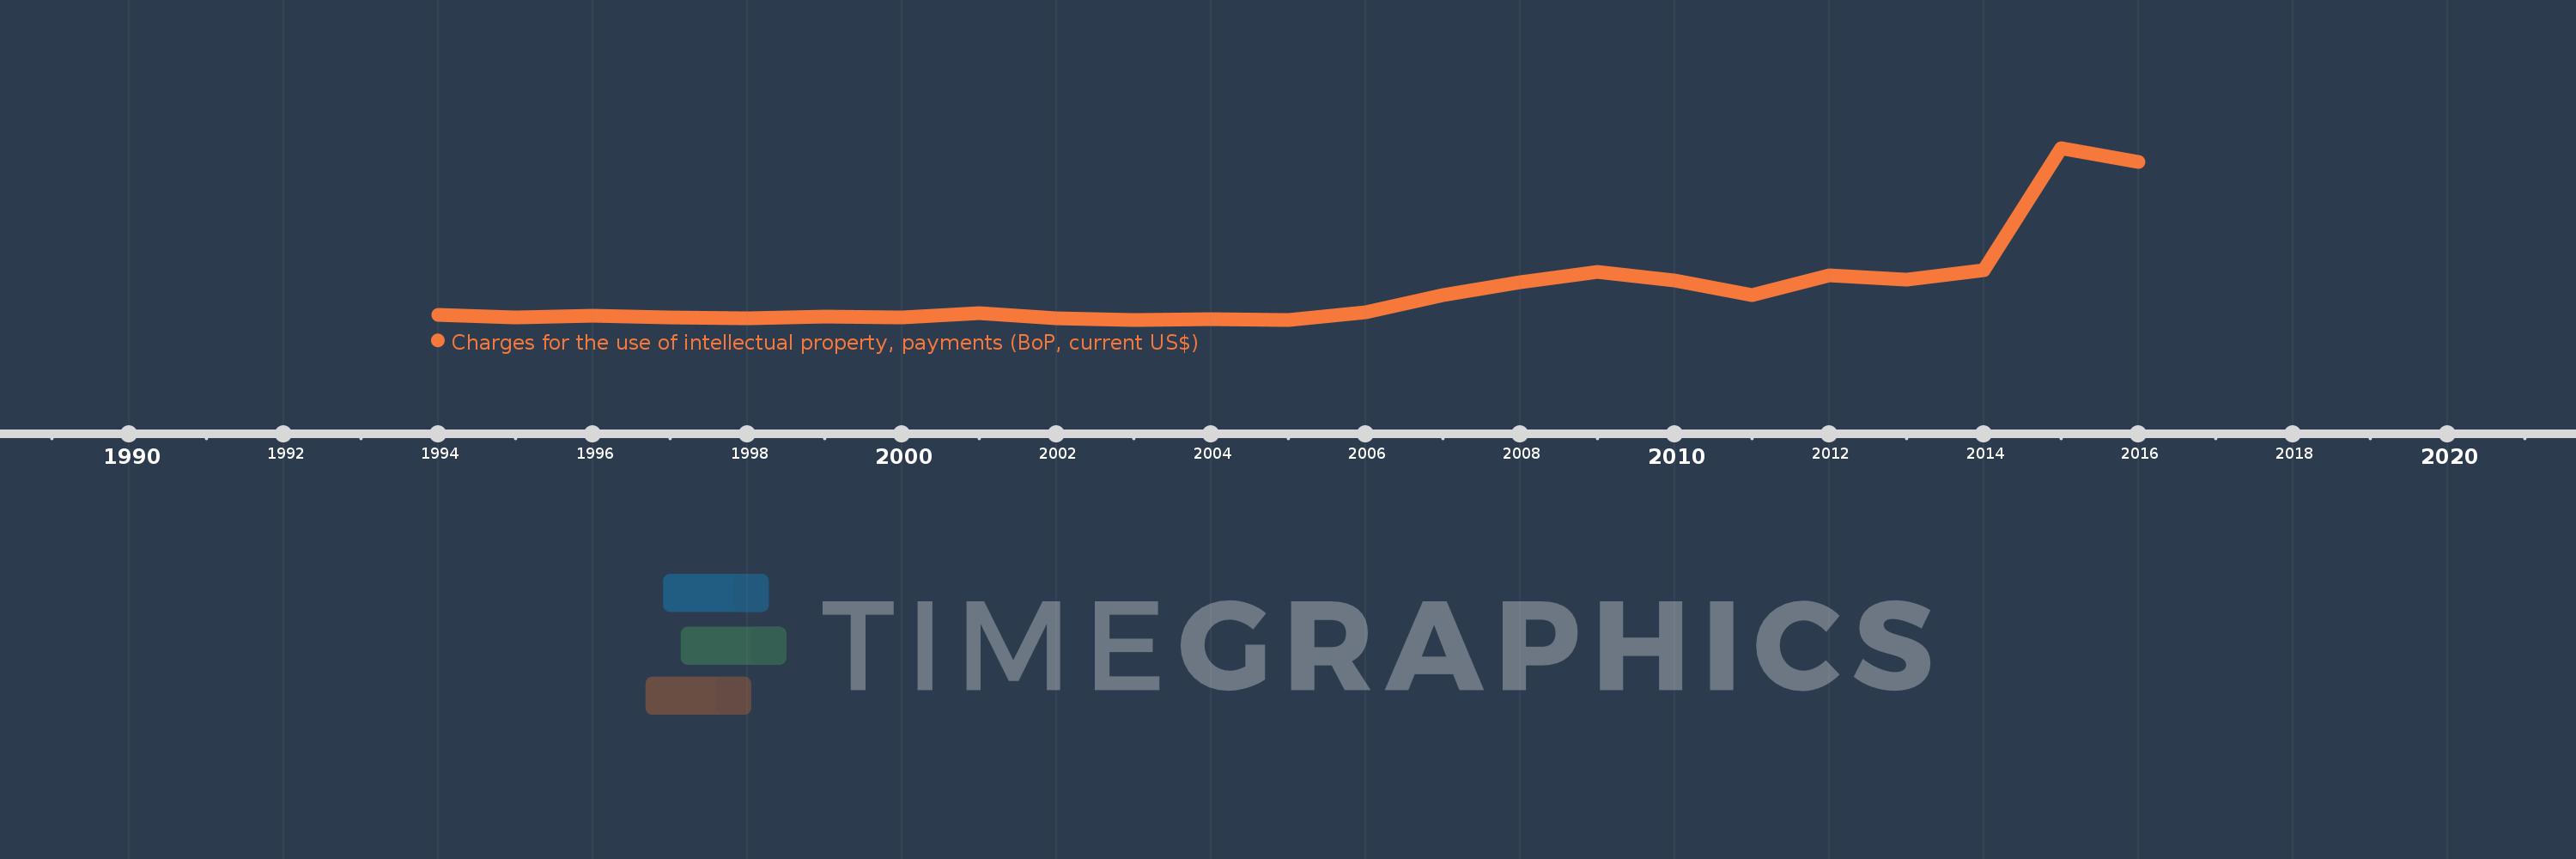
Charges for the use of intellectual property, payments (BoP, current US$)
2016,2015,2014,2013,2012,2011,2010,2009,2008,2007,2006,2005,2004,2003,2002,2001,2000,1999,1998,1997,1996,1995,1994
This statistics in other country:
Timeline:
This timeline shows a graph from 1994 to 2016 of Solomon Islands. No data until 1993. Number of actual observations by date: 23.
Source name:
World Development Indicators
Source organization:
International Monetary Fund, Balance of Payments Statistics Yearbook and data files.
Categories, topics:
Economy & Growth, Science & Technology
Last updated:
apr 23, 2017
Indicators value changes by year
Minimum:
2.372K
jan 1, 2003
Maximum:
5.205 mln
jan 1, 2015
At the date of observation
Value
Absolute change
Change from previous value
jan 1, 1994
156.851K
+156.851K
0.0%
jan 1, 1995
60.765K
-96.086K
-61.26%
jan 1, 1996
117.443K
+56.678K
93.27%
jan 1, 1997
84.119K
-33.324K
-28.37%
jan 1, 1998
53.808K
-30.312K
-36.03%
jan 1, 1999
103.828K
+50.02K
92.96%
jan 1, 2000
62.007K
-41.821K
-40.28%
jan 1, 2001
196.505K
+134.498K
216.91%
jan 1, 2002
56.84K
-139.665K
-71.07%
jan 1, 2003
2.372K
-54.468K
-95.83%
jan 1, 2004
9.565K
+7.193K
303.27%
jan 1, 2005
5.795K
-3.77K
-39.41%
jan 1, 2006
240.815K
+235.02K
4.06K%
jan 1, 2007
746.456K
+505.641K
209.97%
jan 1, 2008
1.128 mln
+381.838K
51.15%
jan 1, 2009
1.45 mln
+321.913K
28.53%
jan 1, 2010
1.197 mln
-253.498K
-17.48%
jan 1, 2011
738.655K
-458.053K
-38.28%
jan 1, 2012
1.359 mln
+620.839K
84.05%
jan 1, 2013
1.22 mln
-139.765K
-10.28%
jan 1, 2014
1.491 mln
+271.552K
22.26%
jan 1, 2015
5.205 mln
+3.714 mln
249.05%
jan 1, 2016
4.779 mln
-425.946K
-8.18%
Ranking of countries by current statistics by years


Comments: