29
/
en
AIzaSyAYiBZKx7MnpbEhh9jyipgxe19OcubqV5w
April 1, 2024
201295
Morocco
MAR
true
2
1
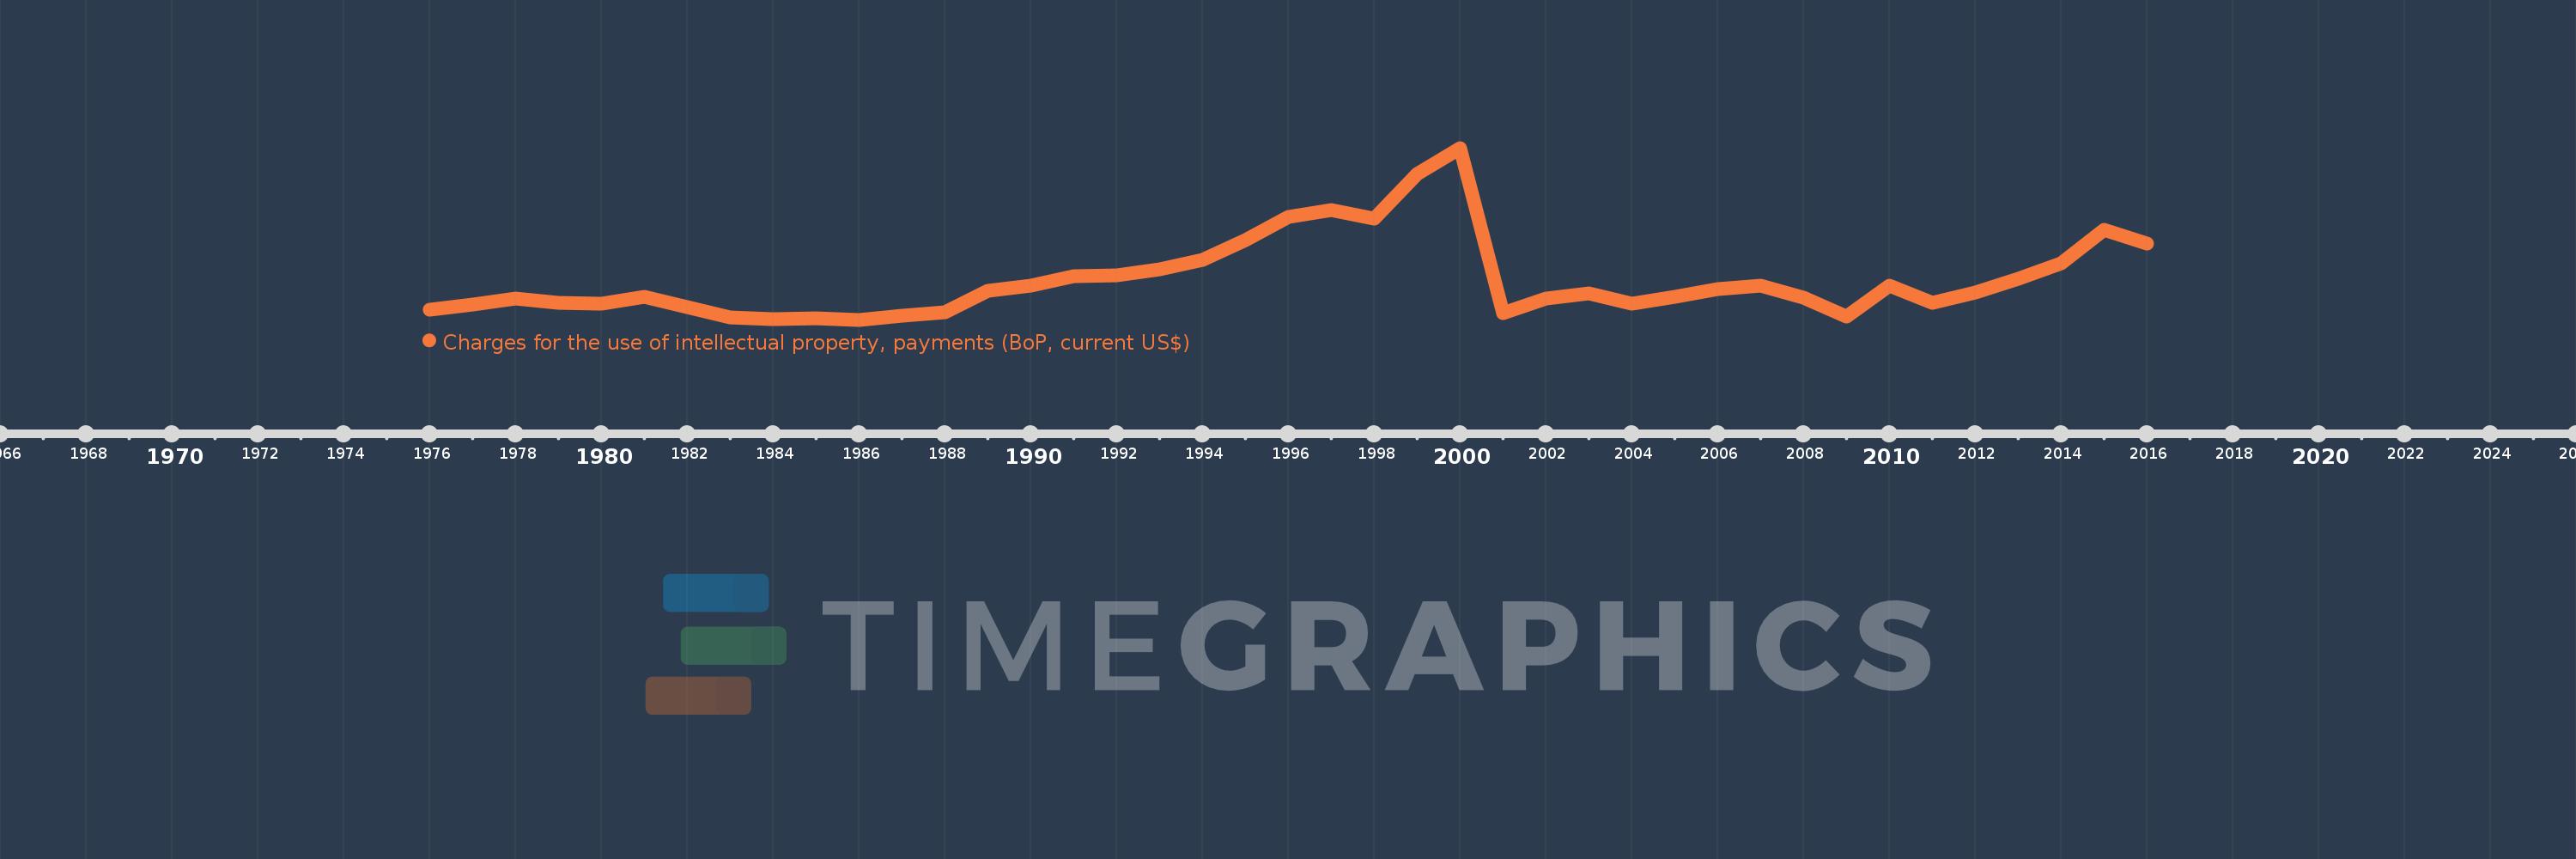
Charges for the use of intellectual property, payments (BoP, current US$)
2016,2015,2014,2013,2012,2011,2010,2009,2008,2007,2006,2005,2004,2003,2002,2001,2000,1999,1998,1997,1996,1995,1994,1993,1992,1991,1990,1989,1988,1987,1986,1985,1984,1983,1982,1981,1980,1979,1978,1977,1976
This statistics in other country:
Timeline:
This timeline shows a graph from 1976 to 2016 of Morocco. No data until 1975. Number of actual observations by date: 41.
Source name:
World Development Indicators
Source organization:
International Monetary Fund, Balance of Payments Statistics Yearbook and data files.
Categories, topics:
Economy & Growth, Science & Technology
Last updated:
apr 23, 2017
Indicators value changes by year
Minimum:
11.627 mln
jan 1, 1986
Maximum:
201.032 mln
jan 1, 2000
At the date of observation
Value
Absolute change
Change from previous value
jan 1, 1976
22.702 mln
+22.702 mln
0.0%
jan 1, 1977
28.738 mln
+6.035 mln
26.59%
jan 1, 1978
35.085 mln
+6.348 mln
22.09%
jan 1, 1979
30.0 mln
-5.085 mln
-14.49%
jan 1, 1980
29.75 mln
-249.775K
-0.83%
jan 1, 1981
36.833 mln
+7.083 mln
23.81%
jan 1, 1982
25.327 mln
-11.506 mln
-31.24%
jan 1, 1983
14.113 mln
-11.215 mln
-44.28%
jan 1, 1984
12.093 mln
-2.019 mln
-14.31%
jan 1, 1985
13.393 mln
+1.3 mln
10.75%
jan 1, 1986
11.627 mln
-1.766 mln
-13.18%
jan 1, 1987
16.256 mln
+4.628 mln
39.81%
jan 1, 1988
19.978 mln
+3.722 mln
22.9%
jan 1, 1989
43.732 mln
+23.754 mln
118.9%
jan 1, 1990
49.481 mln
+5.749 mln
13.15%
jan 1, 1991
59.57 mln
+10.09 mln
20.39%
jan 1, 1992
60.414 mln
+843.836K
1.42%
jan 1, 1993
67.113 mln
+6.698 mln
11.09%
jan 1, 1994
77.753 mln
+10.64 mln
15.85%
jan 1, 1995
99.536 mln
+21.783 mln
28.02%
jan 1, 1996
125.055 mln
+25.519 mln
25.64%
jan 1, 1997
132.976 mln
+7.921 mln
6.33%
jan 1, 1998
122.912 mln
-10.063 mln
-7.57%
jan 1, 1999
172.317 mln
+49.404 mln
40.19%
jan 1, 2000
201.032 mln
+28.715 mln
16.66%
jan 1, 2001
19.067 mln
-181.965 mln
-90.52%
jan 1, 2002
35.371 mln
+16.304 mln
85.51%
jan 1, 2003
40.542 mln
+5.171 mln
14.62%
jan 1, 2004
28.963 mln
-11.579 mln
-28.56%
jan 1, 2005
36.739 mln
+7.776 mln
26.85%
jan 1, 2006
45.408 mln
+8.669 mln
23.6%
jan 1, 2007
49.157 mln
+3.749 mln
8.26%
jan 1, 2008
35.994 mln
-13.163 mln
-26.78%
jan 1, 2009
15.36 mln
-20.634 mln
-57.33%
jan 1, 2010
48.852 mln
+33.492 mln
218.05%
jan 1, 2011
30.432 mln
-18.42 mln
-37.71%
jan 1, 2012
41.35 mln
+10.917 mln
35.87%
jan 1, 2013
56.845 mln
+15.495 mln
37.47%
jan 1, 2014
73.903 mln
+17.058 mln
30.01%
jan 1, 2015
111.106 mln
+37.203 mln
50.34%
jan 1, 2016
95.601 mln
-15.505 mln
-13.96%
Ranking of countries by current statistics by years


Comments: