29
/
en
AIzaSyAYiBZKx7MnpbEhh9jyipgxe19OcubqV5w
April 1, 2024
224617
Poland
POL
true
2
1
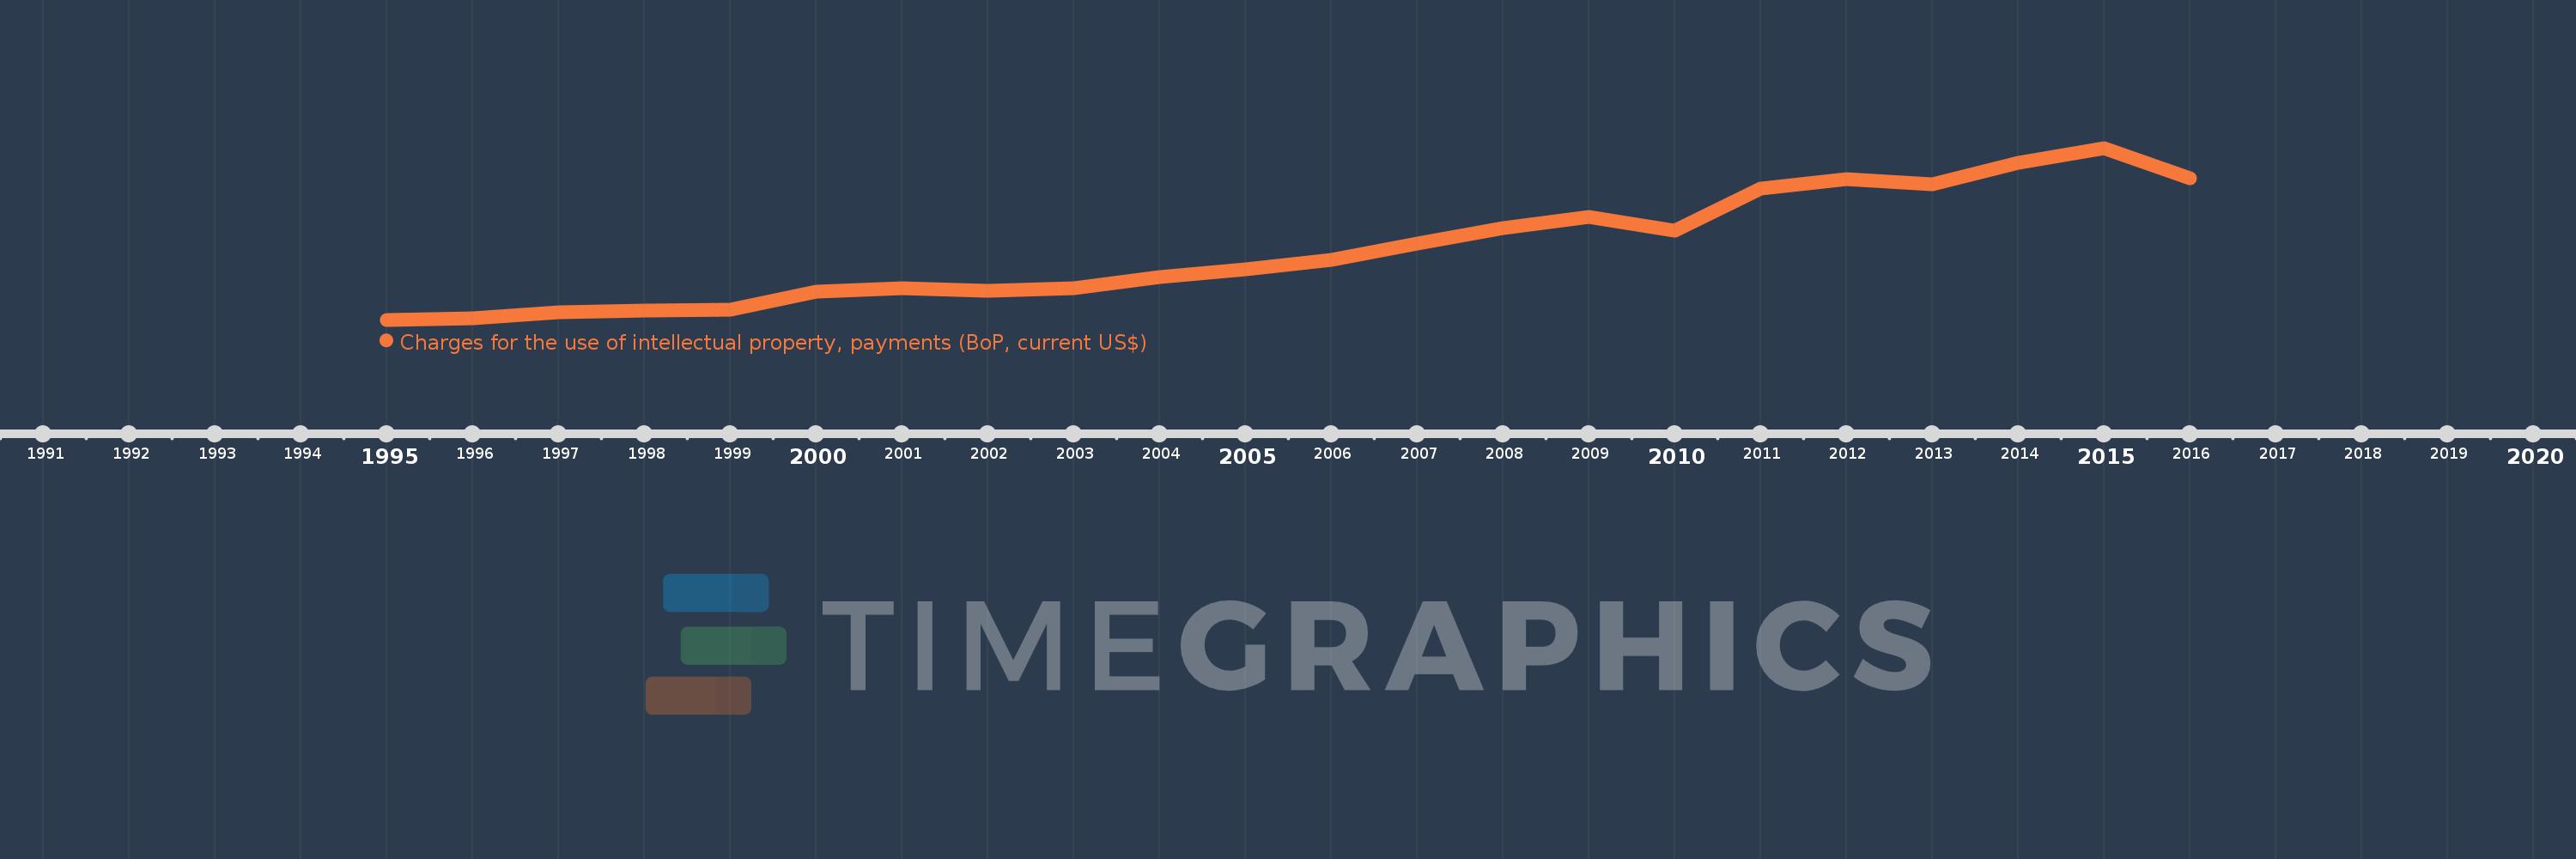
Charges for the use of intellectual property, payments (BoP, current US$)
2016,2015,2014,2013,2012,2011,2010,2009,2008,2007,2006,2005,2004,2003,2002,2001,2000,1999,1998,1997,1996,1995
This statistics in other country:
Timeline:
This timeline shows a graph from 1995 to 2016 of Poland. No data until 1994. Number of actual observations by date: 22.
Source name:
World Development Indicators
Source organization:
International Monetary Fund, Balance of Payments Statistics Yearbook and data files.
Categories, topics:
Economy & Growth, Science & Technology
Last updated:
apr 23, 2017
Indicators value changes by year
Minimum:
18.0 mln
jan 1, 1995
Maximum:
2.945 bln
jan 1, 2015
At the date of observation
Value
Absolute change
Change from previous value
jan 1, 1995
18.0 mln
+18.0 mln
0.0%
jan 1, 1996
44.0 mln
+26.0 mln
144.44%
jan 1, 1997
144.0 mln
+100.0 mln
227.27%
jan 1, 1998
175.0 mln
+31.0 mln
21.53%
jan 1, 1999
195.0 mln
+20.0 mln
11.43%
jan 1, 2000
491.0 mln
+296.0 mln
151.79%
jan 1, 2001
555.0 mln
+64.0 mln
13.03%
jan 1, 2002
508.0 mln
-47.0 mln
-8.47%
jan 1, 2003
557.0 mln
+49.0 mln
9.65%
jan 1, 2004
745.0 mln
+188.0 mln
33.75%
jan 1, 2005
883.0 mln
+138.0 mln
18.52%
jan 1, 2006
1.036 bln
+153.0 mln
17.33%
jan 1, 2007
1.313 bln
+277.0 mln
26.74%
jan 1, 2008
1.575 bln
+262.0 mln
19.95%
jan 1, 2009
1.773 bln
+198.0 mln
12.57%
jan 1, 2010
1.542 bln
-231.0 mln
-13.03%
jan 1, 2011
2.248 bln
+706.0 mln
45.78%
jan 1, 2012
2.407 bln
+159.0 mln
7.07%
jan 1, 2013
2.332 bln
-75.0 mln
-3.12%
jan 1, 2014
2.693 bln
+361.0 mln
15.48%
jan 1, 2015
2.945 bln
+252.0 mln
9.36%
jan 1, 2016
2.431 bln
-514.0 mln
-17.45%
Ranking of countries by current statistics by years


Comments: