29
/
en
AIzaSyAYiBZKx7MnpbEhh9jyipgxe19OcubqV5w
April 1, 2024
55359
Pre-demographic dividend
PRE
false
2
1
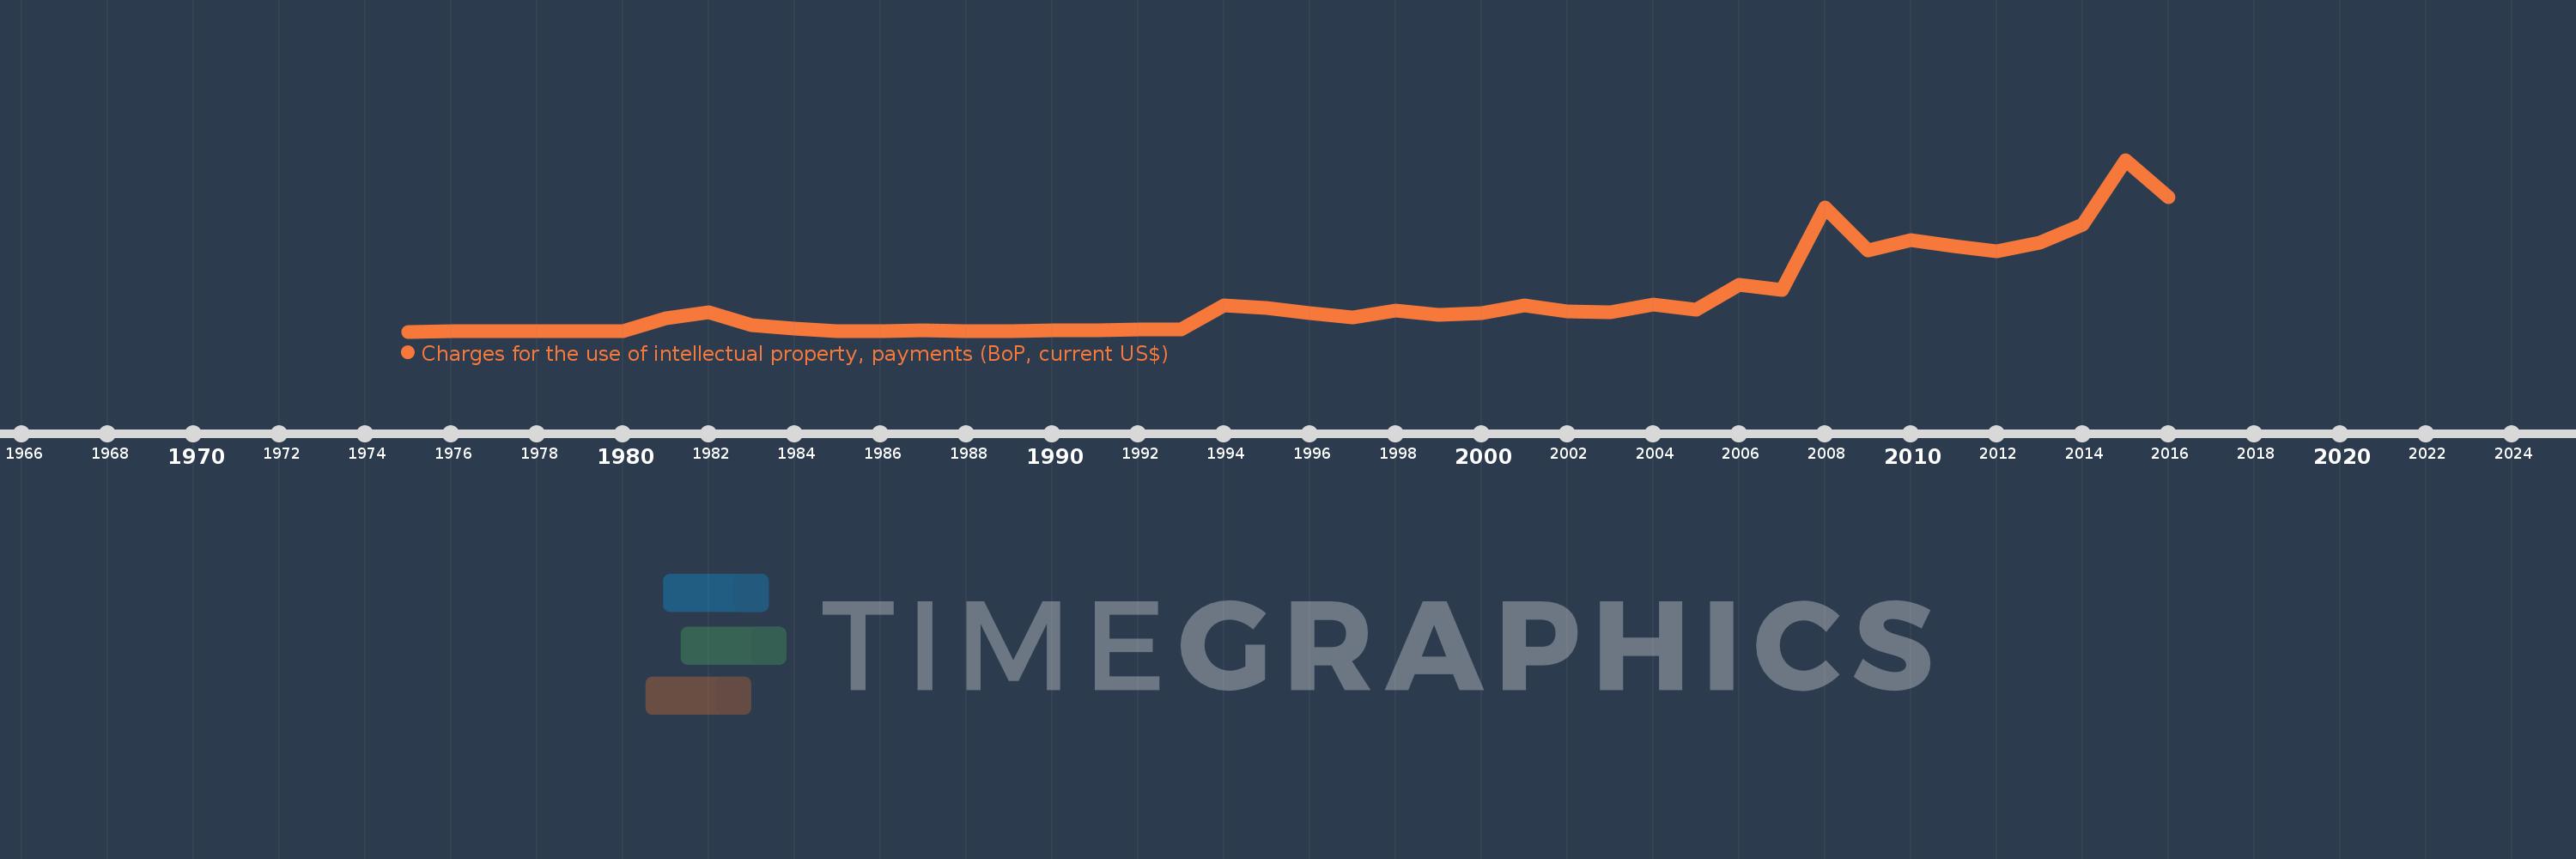
Charges for the use of intellectual property, payments (BoP, current US$)
2016,2015,2014,2013,2012,2011,2010,2009,2008,2007,2006,2005,2004,2003,2002,2001,2000,1999,1998,1997,1996,1995,1994,1993,1992,1991,1990,1989,1988,1987,1986,1985,1984,1983,1982,1981,1980,1979,1978,1977,1976,1975
This statistics in other country:
Timeline:
This timeline shows a graph from 1975 to 2016 of Pre-demographic dividend. No data until 1974. Number of actual observations by date: 42.
Source name:
World Development Indicators
Source organization:
International Monetary Fund, Balance of Payments Statistics Yearbook and data files.
Categories, topics:
Economy & Growth, Science & Technology
Last updated:
apr 23, 2017
Indicators value changes by year
Minimum:
124.634K
jan 1, 1975
Maximum:
720.734 mln
jan 1, 2015
At the date of observation
Value
Absolute change
Change from previous value
jan 1, 1975
124.634K
+124.634K
0.0%
jan 1, 1976
139.982K
+15.348K
12.31%
jan 1, 1977
125.549K
-14.433K
-10.31%
jan 1, 1978
1.099 mln
+973.447K
775.35%
jan 1, 1979
1.418 mln
+319.097K
29.04%
jan 1, 1980
1.692 mln
+274.265K
19.34%
jan 1, 1981
55.151 mln
+53.458 mln
3.16K%
jan 1, 1982
81.349 mln
+26.199 mln
47.5%
jan 1, 1983
27.093 mln
-54.256 mln
-66.7%
jan 1, 1984
14.18 mln
-12.913 mln
-47.66%
jan 1, 1985
3.149 mln
-11.03 mln
-77.79%
jan 1, 1986
2.518 mln
-630.981K
-20.04%
jan 1, 1987
3.915 mln
+1.397 mln
55.47%
jan 1, 1988
2.96 mln
-955.553K
-24.41%
jan 1, 1989
2.455 mln
-504.143K
-17.03%
jan 1, 1990
5.388 mln
+2.933 mln
119.44%
jan 1, 1991
6.787 mln
+1.399 mln
25.96%
jan 1, 1992
8.428 mln
+1.641 mln
24.18%
jan 1, 1993
10.438 mln
+2.009 mln
23.84%
jan 1, 1994
111.653 mln
+101.215 mln
969.72%
jan 1, 1995
97.518 mln
-14.135 mln
-12.66%
jan 1, 1996
76.319 mln
-21.2 mln
-21.74%
jan 1, 1997
60.296 mln
-16.023 mln
-20.99%
jan 1, 1998
89.21 mln
+28.914 mln
47.95%
jan 1, 1999
71.031 mln
-18.179 mln
-20.38%
jan 1, 2000
78.61 mln
+7.58 mln
10.67%
jan 1, 2001
111.096 mln
+32.485 mln
41.32%
jan 1, 2002
83.291 mln
-27.804 mln
-25.03%
jan 1, 2003
80.365 mln
-2.926 mln
-3.51%
jan 1, 2004
111.98 mln
+31.615 mln
39.34%
jan 1, 2005
93.761 mln
-18.22 mln
-16.27%
jan 1, 2006
198.229 mln
+104.468 mln
111.42%
jan 1, 2007
174.576 mln
-23.652 mln
-11.93%
jan 1, 2008
519.329 mln
+344.753 mln
197.48%
jan 1, 2009
341.424 mln
-177.905 mln
-34.26%
jan 1, 2010
383.286 mln
+41.862 mln
12.26%
jan 1, 2011
360.417 mln
-22.869 mln
-5.97%
jan 1, 2012
337.515 mln
-22.903 mln
-6.35%
jan 1, 2013
374.047 mln
+36.532 mln
10.82%
jan 1, 2014
449.526 mln
+75.479 mln
20.18%
jan 1, 2015
720.734 mln
+271.208 mln
60.33%
jan 1, 2016
564.742 mln
-155.992 mln
-21.64%
Ranking of countries by current statistics by years


Comments: