29
/
en
AIzaSyAYiBZKx7MnpbEhh9jyipgxe19OcubqV5w
April 1, 2024
75373
Azerbaijan
AZE
true
2
1
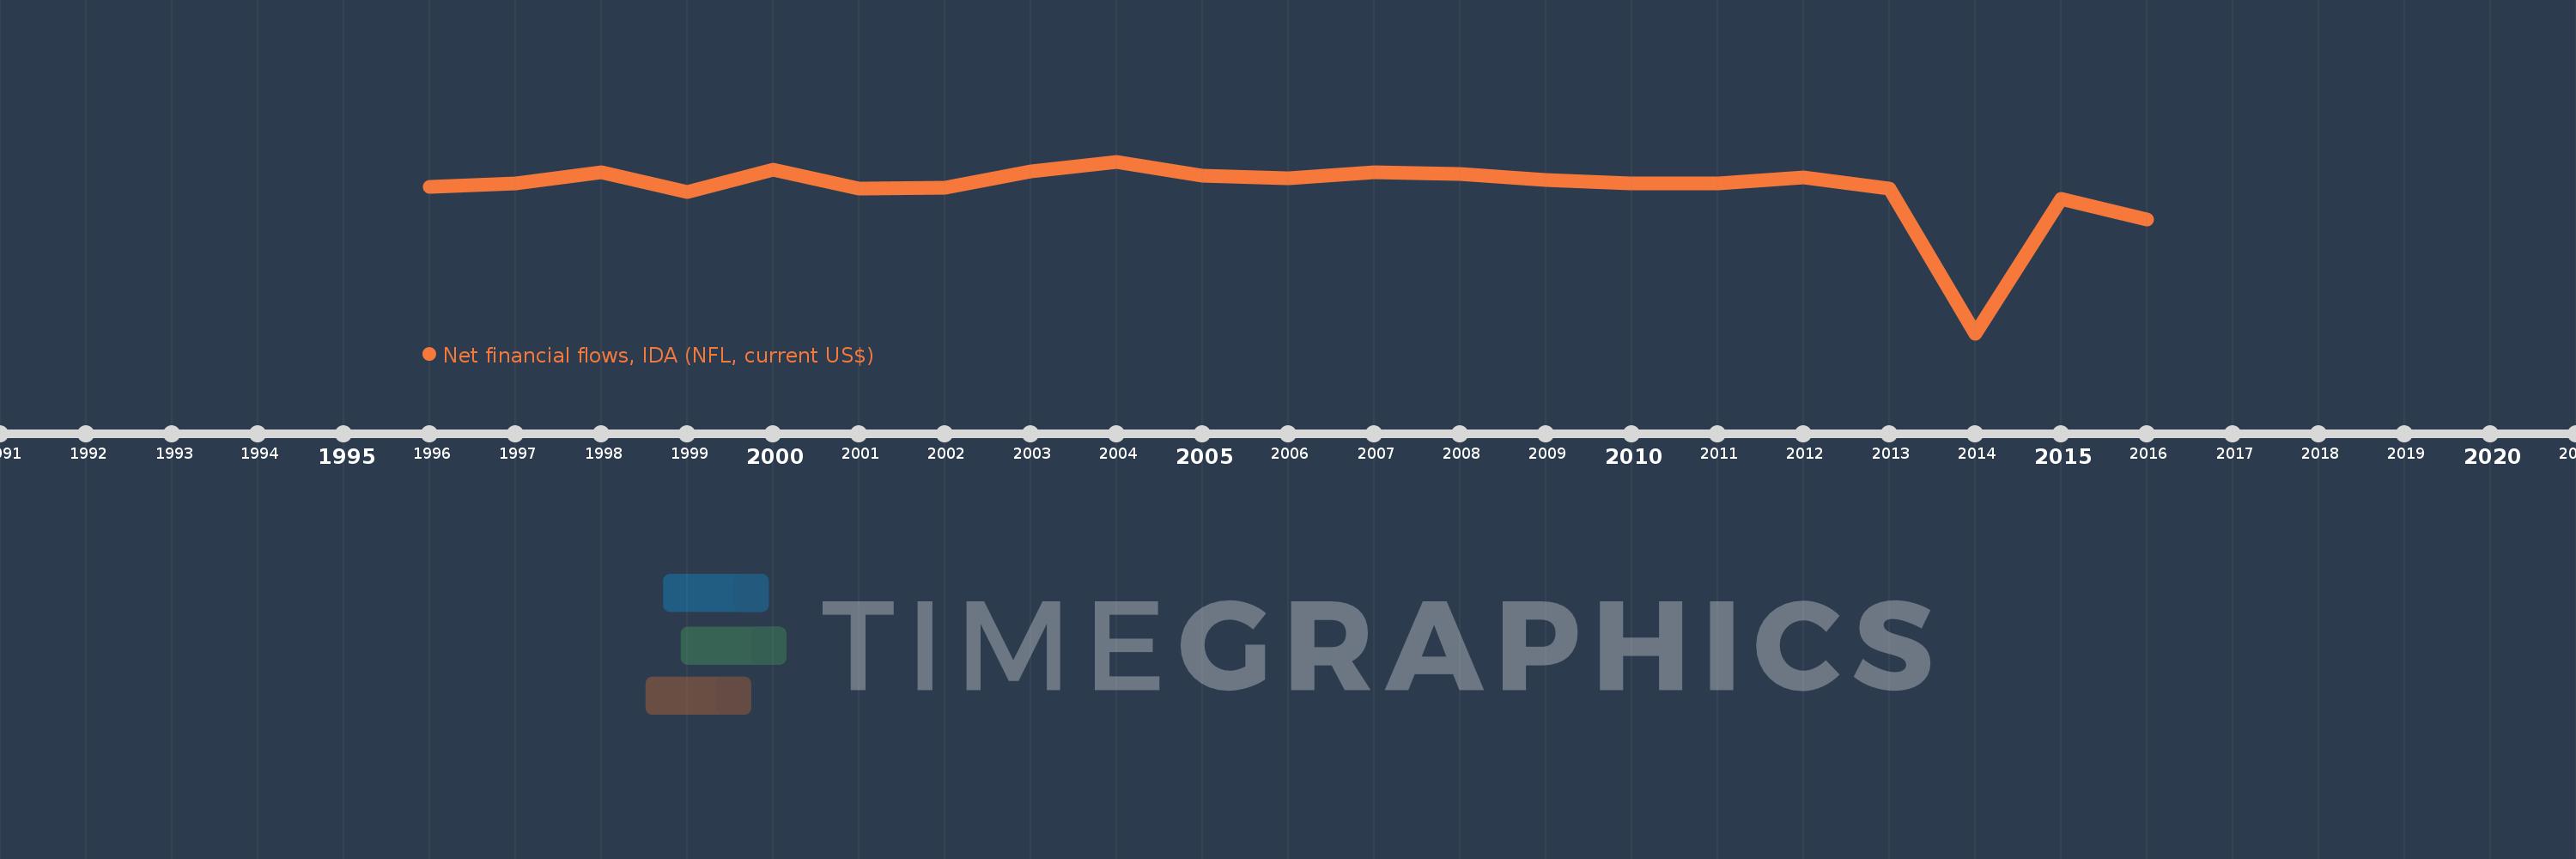
Net financial flows, IDA (NFL, current US$)
2016,2015,2014,2013,2012,2011,2010,2009,2008,2007,2006,2005,2004,2003,2002,2001,2000,1999,1998,1997,1996
This statistics in other country:
Timeline:
This timeline shows a graph from 1996 to 2016 of Azerbaijan. No data until 1995. Number of actual observations by date: 21.
Source name:
World Development Indicators
Source organization:
World Bank, International Debt Statistics.
Categories, topics:
External Debt
Last updated:
apr 23, 2017
Indicators value changes by year
Minimum:
-231.522 mln
jan 1, 2014
Maximum:
74.742 mln
jan 1, 2004
At the date of observation
Value
Absolute change
Change from previous value
jan 1, 1996
30.204 mln
+30.204 mln
0.0%
jan 1, 1997
35.84 mln
+5.636 mln
18.66%
jan 1, 1998
55.352 mln
+19.512 mln
54.44%
jan 1, 1999
20.635 mln
-34.717 mln
-62.72%
jan 1, 2000
60.496 mln
+39.861 mln
193.17%
jan 1, 2001
27.196 mln
-33.3 mln
-55.04%
jan 1, 2002
27.557 mln
+361.0K
1.33%
jan 1, 2003
56.919 mln
+29.362 mln
106.55%
jan 1, 2004
74.742 mln
+17.823 mln
31.31%
jan 1, 2005
49.165 mln
-25.577 mln
-34.22%
jan 1, 2006
45.634 mln
-3.531 mln
-7.18%
jan 1, 2007
56.313 mln
+10.679 mln
23.4%
jan 1, 2008
51.982 mln
-4.331 mln
-7.69%
jan 1, 2009
42.157 mln
-9.825 mln
-18.9%
jan 1, 2010
36.081 mln
-6.076 mln
-14.41%
jan 1, 2011
35.925 mln
-156.0K
-0.43%
jan 1, 2012
46.739 mln
+10.814 mln
30.1%
jan 1, 2013
26.451 mln
-20.288 mln
-43.41%
jan 1, 2014
-231.522 mln
-257.973 mln
-975.29%
jan 1, 2015
8.36 mln
+239.882 mln
-103.61%
jan 1, 2016
-29.184 mln
-37.544 mln
-449.09%
Ranking of countries by current statistics by years


Comments: