29
/
en
AIzaSyAYiBZKx7MnpbEhh9jyipgxe19OcubqV5w
April 1, 2024
190597
Mali
MLI
true
2
1
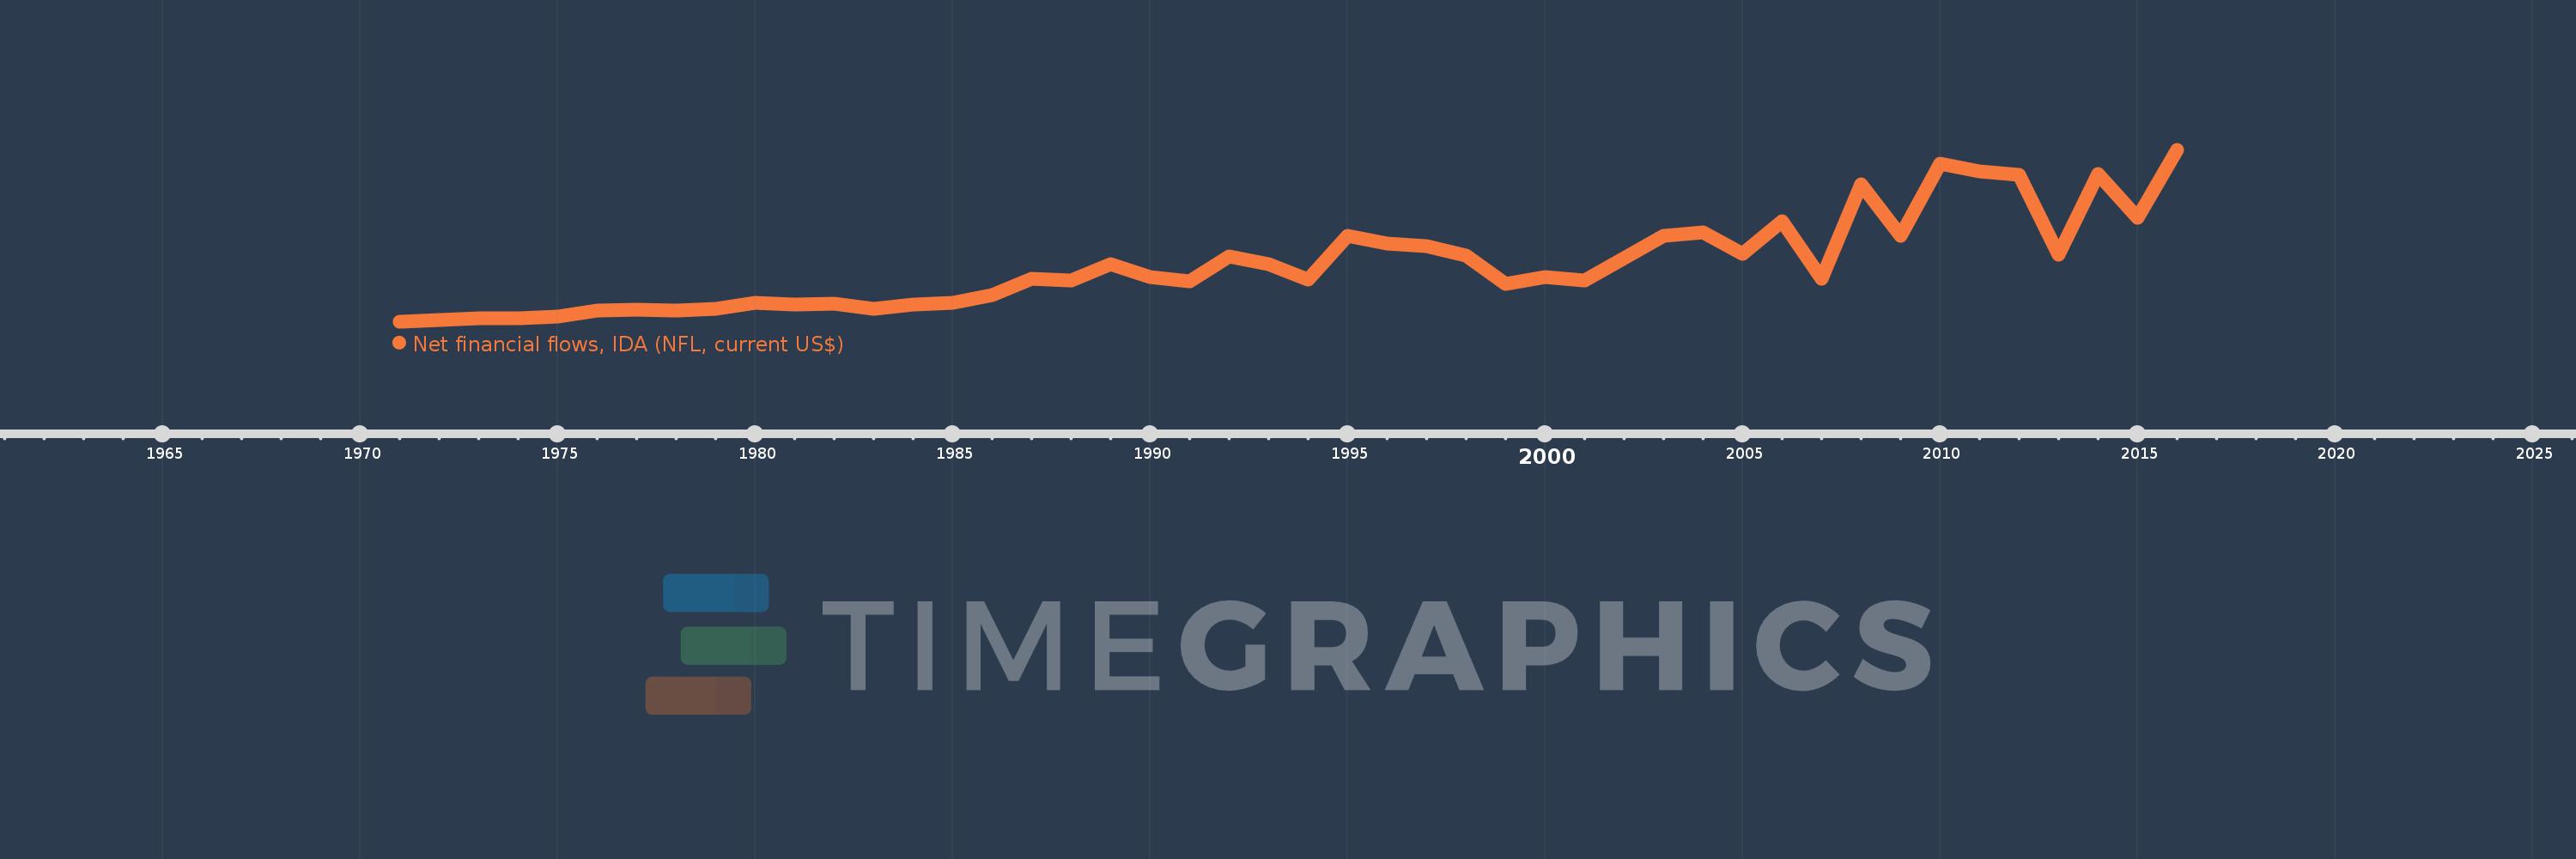
Net financial flows, IDA (NFL, current US$)
2016,2015,2014,2013,2012,2011,2010,2009,2008,2007,2006,2005,2004,2003,2002,2001,2000,1999,1998,1997,1996,1995,1994,1993,1992,1991,1990,1989,1988,1987,1986,1985,1984,1983,1982,1981,1980,1979,1978,1977,1976,1975,1974,1973,1972,1971
This statistics in other country:
Timeline:
This timeline shows a graph from 1971 to 2016 of Mali. No data until 1970. Number of actual observations by date: 46.
Source name:
World Development Indicators
Source organization:
World Bank, International Debt Statistics.
Categories, topics:
External Debt
Last updated:
apr 23, 2017
Indicators value changes by year
Minimum:
1.2 mln
jan 1, 1971
Maximum:
172.479 mln
jan 1, 2016
At the date of observation
Value
Absolute change
Change from previous value
jan 1, 1971
1.2 mln
+1.2 mln
0.0%
jan 1, 1972
3.388 mln
+2.188 mln
182.33%
jan 1, 1973
5.007 mln
+1.619 mln
47.79%
jan 1, 1974
4.496 mln
-511.0K
-10.21%
jan 1, 1975
6.54 mln
+2.044 mln
45.46%
jan 1, 1976
12.765 mln
+6.225 mln
95.18%
jan 1, 1977
13.432 mln
+667.0K
5.23%
jan 1, 1978
12.646 mln
-786.0K
-5.85%
jan 1, 1979
14.468 mln
+1.822 mln
14.41%
jan 1, 1980
20.447 mln
+5.979 mln
41.33%
jan 1, 1981
18.802 mln
-1.645 mln
-8.05%
jan 1, 1982
19.047 mln
+245.0K
1.3%
jan 1, 1983
14.07 mln
-4.977 mln
-26.13%
jan 1, 1984
18.474 mln
+4.404 mln
31.3%
jan 1, 1985
20.468 mln
+1.994 mln
10.79%
jan 1, 1986
28.365 mln
+7.897 mln
38.58%
jan 1, 1987
44.077 mln
+15.712 mln
55.39%
jan 1, 1988
42.171 mln
-1.906 mln
-4.32%
jan 1, 1989
59.027 mln
+16.856 mln
39.97%
jan 1, 1990
46.302 mln
-12.725 mln
-21.56%
jan 1, 1991
41.478 mln
-4.824 mln
-10.42%
jan 1, 1992
66.736 mln
+25.258 mln
60.89%
jan 1, 1993
58.668 mln
-8.068 mln
-12.09%
jan 1, 1994
43.042 mln
-15.626 mln
-26.63%
jan 1, 1995
87.413 mln
+44.371 mln
103.09%
jan 1, 1996
79.612 mln
-7.801 mln
-8.92%
jan 1, 1997
77.201 mln
-2.411 mln
-3.03%
jan 1, 1998
67.491 mln
-9.71 mln
-12.58%
jan 1, 1999
38.976 mln
-28.515 mln
-42.25%
jan 1, 2000
46.27 mln
+7.294 mln
18.71%
jan 1, 2001
42.174 mln
-4.096 mln
-8.85%
jan 1, 2002
64.646 mln
+22.472 mln
53.28%
jan 1, 2003
87.515 mln
+22.869 mln
35.38%
jan 1, 2004
90.272 mln
+2.757 mln
3.15%
jan 1, 2005
68.986 mln
-21.286 mln
-23.58%
jan 1, 2006
101.989 mln
+33.003 mln
47.84%
jan 1, 2007
44.078 mln
-57.911 mln
-56.78%
jan 1, 2008
138.892 mln
+94.814 mln
215.11%
jan 1, 2009
87.094 mln
-51.798 mln
-37.29%
jan 1, 2010
159.237 mln
+72.143 mln
82.83%
jan 1, 2011
151.328 mln
-7.909 mln
-4.97%
jan 1, 2012
147.674 mln
-3.654 mln
-2.41%
jan 1, 2013
68.503 mln
-79.171 mln
-53.61%
jan 1, 2014
148.629 mln
+80.126 mln
116.97%
jan 1, 2015
105.117 mln
-43.512 mln
-29.28%
jan 1, 2016
172.479 mln
+67.362 mln
64.08%
Ranking of countries by current statistics by years


Comments: