29
/
en
AIzaSyAYiBZKx7MnpbEhh9jyipgxe19OcubqV5w
April 1, 2024
97669
Cabo Verde
CPV
true
2
1
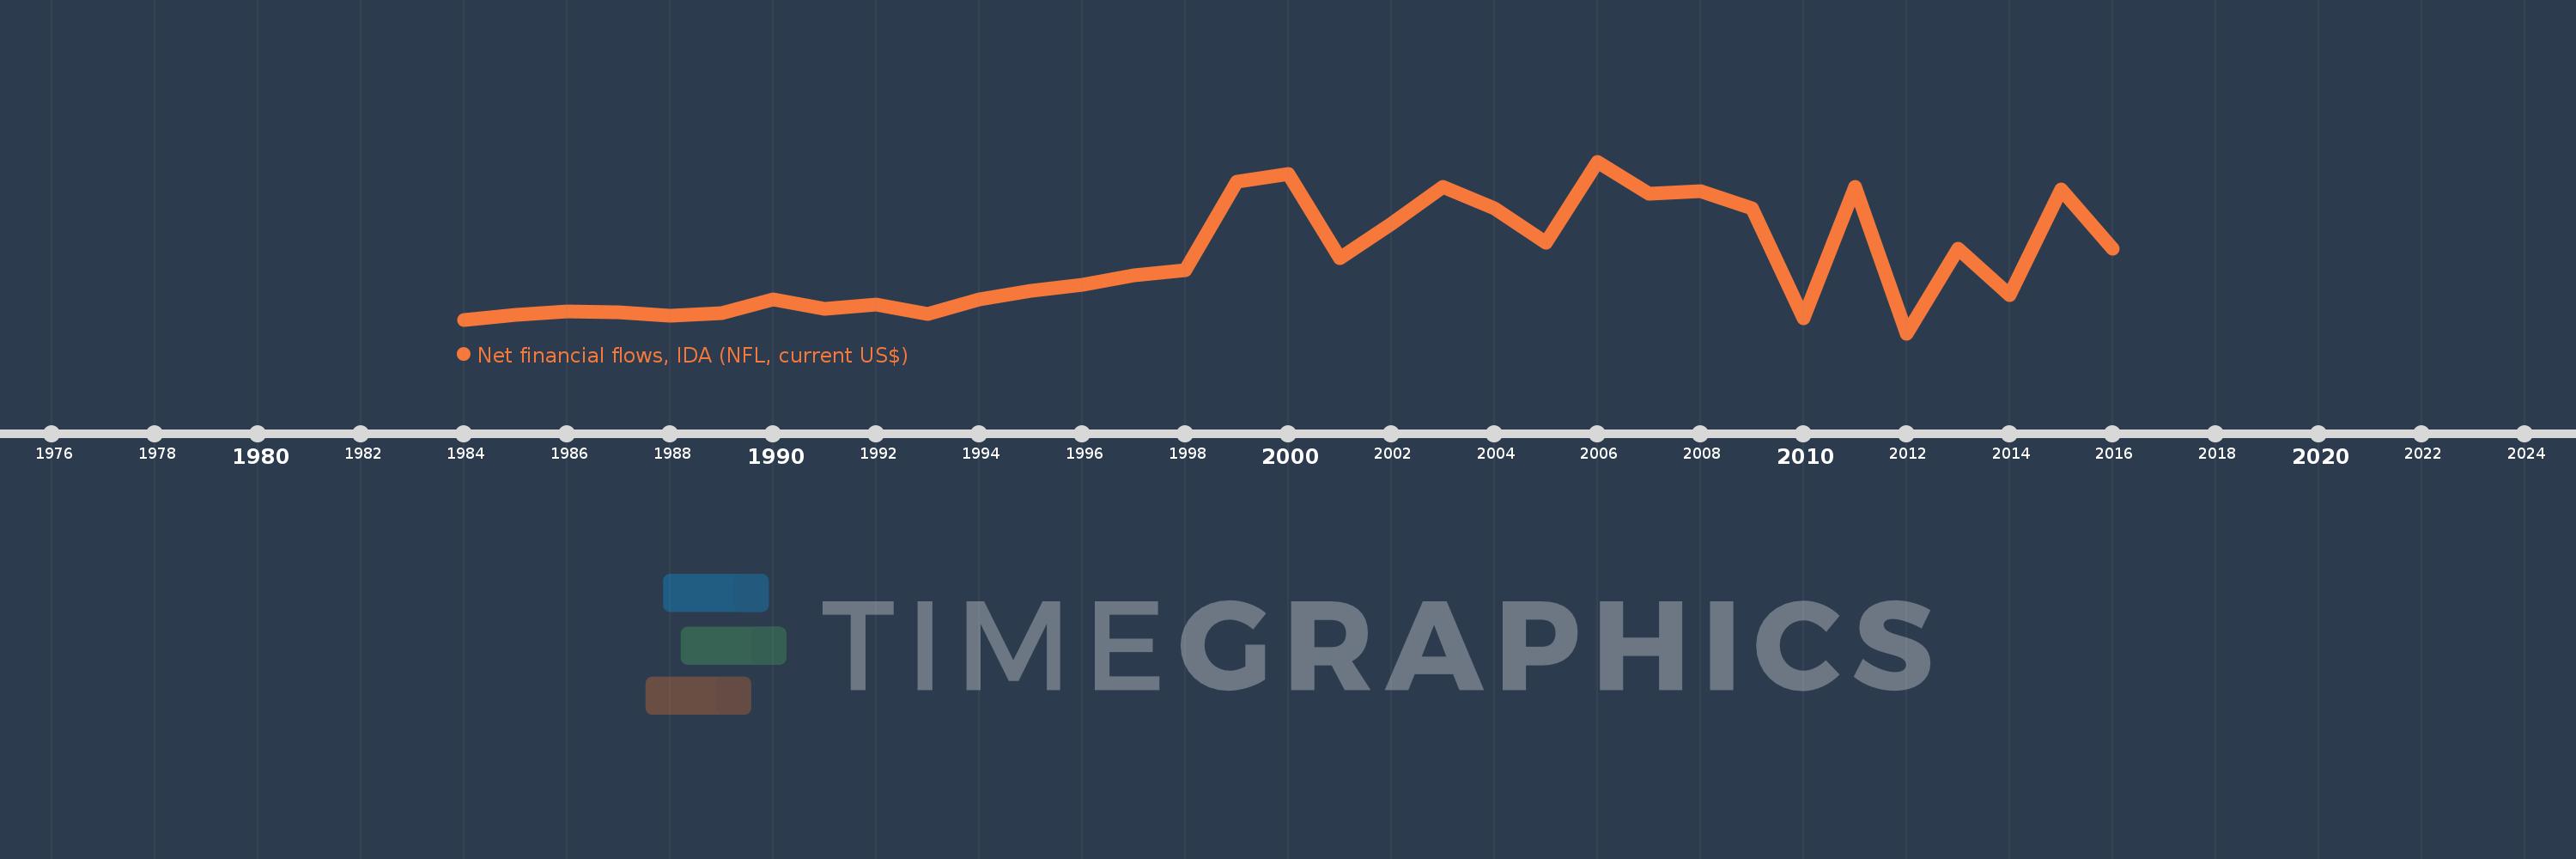
Net financial flows, IDA (NFL, current US$)
2016,2015,2014,2013,2012,2011,2010,2009,2008,2007,2006,2005,2004,2003,2002,2001,2000,1999,1998,1997,1996,1995,1994,1993,1992,1991,1990,1989,1988,1987,1986,1985,1984
This statistics in other country:
Timeline:
This timeline shows a graph from 1984 to 2016 of Cabo Verde. No data until 1983. Number of actual observations by date: 33.
Source name:
World Development Indicators
Source organization:
World Bank, International Debt Statistics.
Categories, topics:
External Debt
Last updated:
apr 23, 2017
Indicators value changes by year
Minimum:
-1.98 mln
jan 1, 2012
Maximum:
25.801 mln
jan 1, 2006
At the date of observation
Value
Absolute change
Change from previous value
jan 1, 1984
214.0K
+214.0K
0.0%
jan 1, 1985
1.056 mln
+842.0K
393.46%
jan 1, 1986
1.519 mln
+463.0K
43.84%
jan 1, 1987
1.476 mln
-43.0K
-2.83%
jan 1, 1988
875.0K
-601.0K
-40.72%
jan 1, 1989
1.349 mln
+474.0K
54.17%
jan 1, 1990
3.464 mln
+2.115 mln
156.78%
jan 1, 1991
1.994 mln
-1.47 mln
-42.44%
jan 1, 1992
2.731 mln
+737.0K
36.96%
jan 1, 1993
1.21 mln
-1.521 mln
-55.69%
jan 1, 1994
3.444 mln
+2.234 mln
184.63%
jan 1, 1995
4.89 mln
+1.446 mln
41.99%
jan 1, 1996
5.906 mln
+1.016 mln
20.78%
jan 1, 1997
7.442 mln
+1.536 mln
26.01%
jan 1, 1998
8.173 mln
+731.0K
9.82%
jan 1, 1999
22.497 mln
+14.324 mln
175.26%
jan 1, 2000
23.833 mln
+1.336 mln
5.94%
jan 1, 2001
10.168 mln
-13.665 mln
-57.34%
jan 1, 2002
15.734 mln
+5.566 mln
54.74%
jan 1, 2003
21.661 mln
+5.927 mln
37.67%
jan 1, 2004
18.29 mln
-3.371 mln
-15.56%
jan 1, 2005
12.687 mln
-5.603 mln
-30.63%
jan 1, 2006
25.801 mln
+13.114 mln
103.37%
jan 1, 2007
20.549 mln
-5.252 mln
-20.36%
jan 1, 2008
20.946 mln
+397.0K
1.93%
jan 1, 2009
18.23 mln
-2.716 mln
-12.97%
jan 1, 2010
488.0K
-17.742 mln
-97.32%
jan 1, 2011
21.698 mln
+21.21 mln
4.35K%
jan 1, 2012
-1.98 mln
-23.678 mln
-109.13%
jan 1, 2013
11.762 mln
+13.742 mln
-694.04%
jan 1, 2014
4.254 mln
-7.508 mln
-63.83%
jan 1, 2015
21.261 mln
+17.007 mln
399.79%
jan 1, 2016
11.749 mln
-9.512 mln
-44.74%
Ranking of countries by current statistics by years


Comments: