30
/
AIzaSyAYiBZKx7MnpbEhh9jyipgxe19OcubqV5w
April 1, 2024
138396
Georgia
GEO
true
2
1
Net financial flows, IDA (NFL, current US$)
2016,2015,2014,2013,2012,2011,2010,2009,2008,2007,2006,2005,2004,2003,2002,2001,2000,1999,1998,1997,1996,1995
Public Timelines
FAQ
Menu
Public Timelines
FAQ
Public Timelines
FAQ
For education
For educational institutions
For teachers
For students
Open cabinet
For educational institutions
For teachers
For students
Open cabinet
Create
Close
Create a timeline
Public timelines
Library
FAQ
Download
Global statistics library
→
Georgia
→
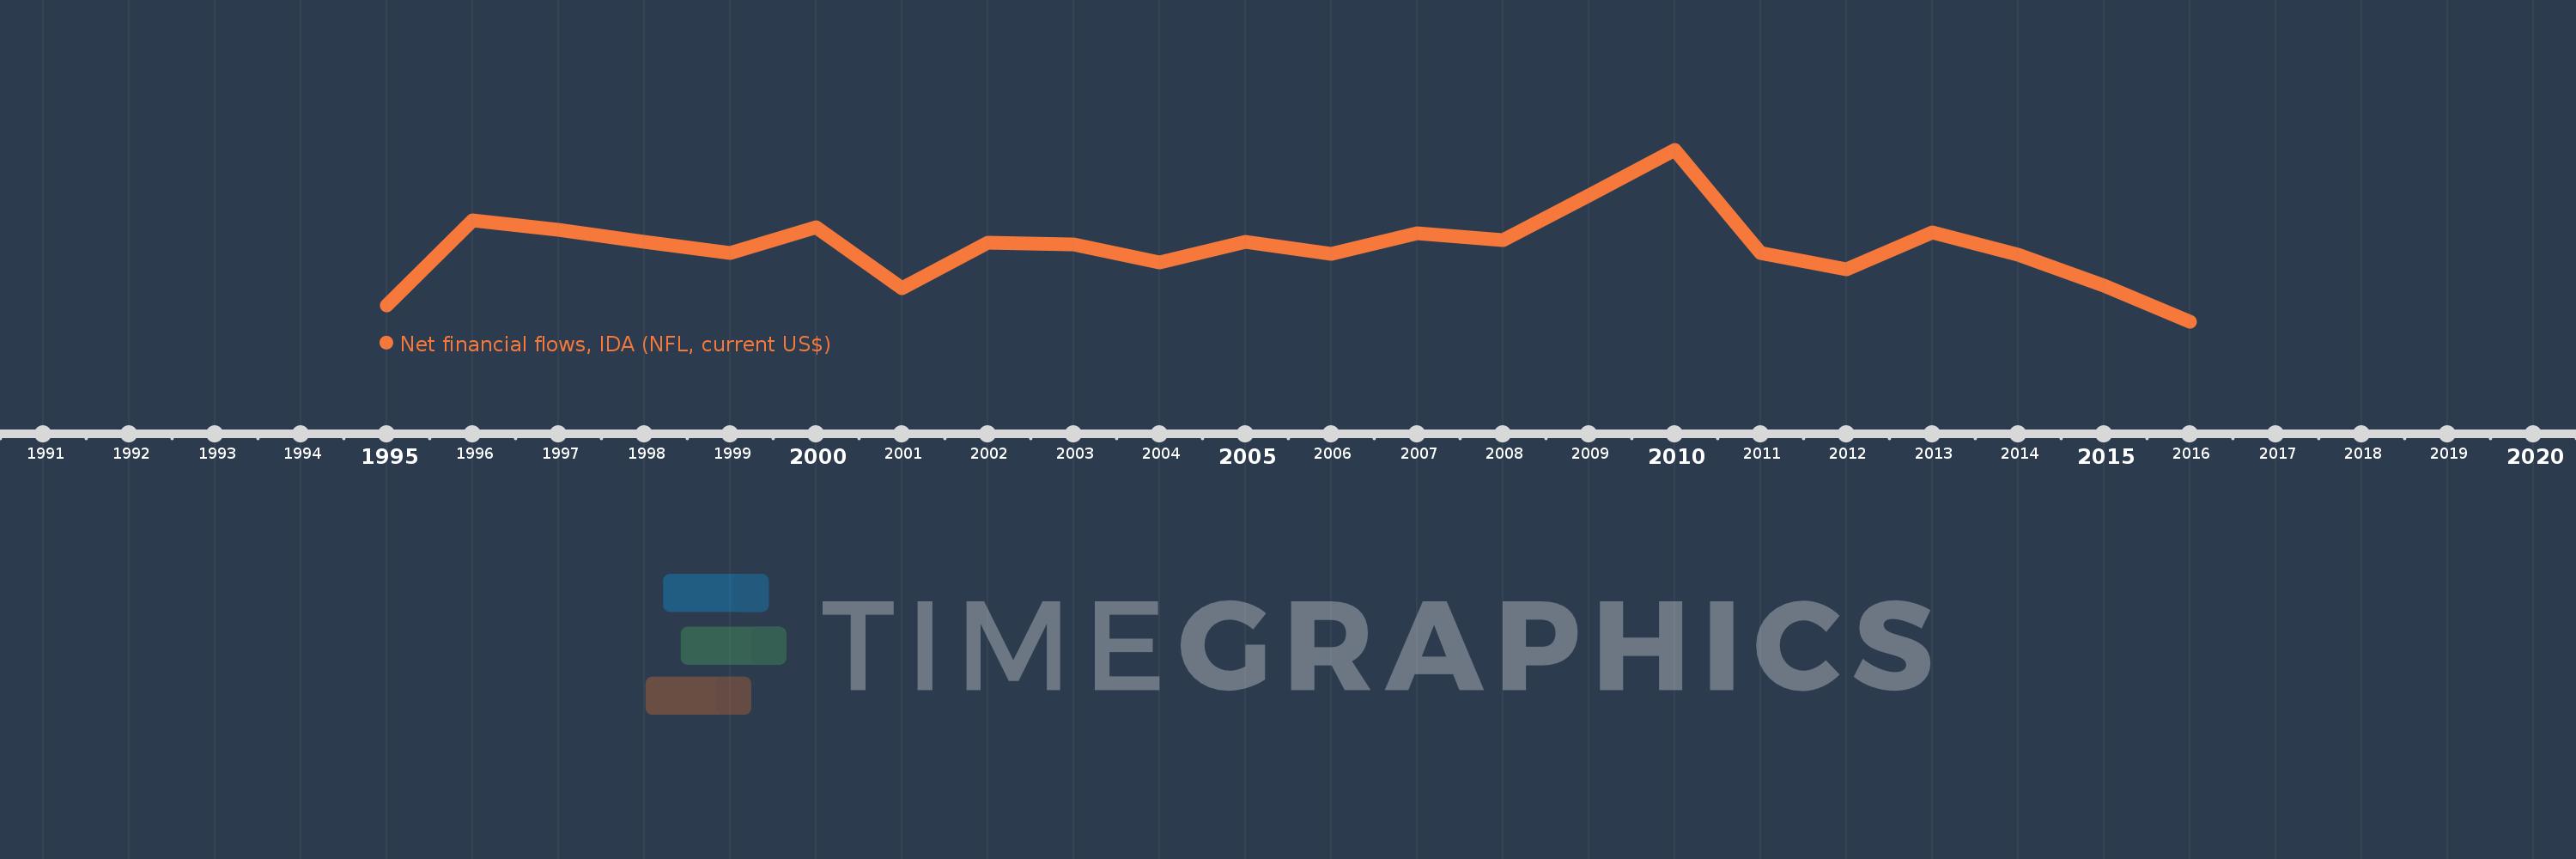
Net financial flows, IDA (NFL, current US$)
This statistics in other country:
Afghanistan
Albania
Angola
Armenia
Azerbaijan
Bangladesh
Benin
Bhutan
Bolivia
Bosnia and Herzegovina
Botswana
Burkina Faso
Burundi
Cabo Verde
Cambodia
Cameroon
Caribbean small states
Central African Republic
Central Europe and the Baltics
Chad
China
Colombia
Comoros
Congo, Dem. Rep.
Congo, Rep.
Costa Rica
Cote d'Ivoire
Croatia
Czech Republic
Djibouti
Dominica
Dominican Republic
Early-demographic dividend
East Asia & Pacific
East Asia & Pacific (excluding high income)
East Asia & Pacific (IDA & IBRD countries)
Ecuador
Egypt, Arab Rep.
El Salvador
Equatorial Guinea
Eritrea
Estonia
Ethiopia
Europe & Central Asia
Europe & Central Asia (excluding high income)
Europe & Central Asia (IDA & IBRD countries)
Fragile and conflict affected situations
Gambia, The
Georgia
Ghana
Greece
Grenada
Guinea
Guinea-Bissau
Guyana
Haiti
Honduras
Hungary
IBRD only
IDA & IBRD total
IDA blend
IDA only
IDA total
India
Indonesia
Jordan
Kenya
Korea, Rep.
Kosovo
Kyrgyz Republic
Lao PDR
Late-demographic dividend
Latin America & Caribbean
Latin America & Caribbean (excluding high income)
Latin America & the Caribbean (IDA & IBRD countries)
Lesotho
Liberia
Low & middle income
Low income
Lower middle income
Macedonia, FYR
Madagascar
Malawi
Maldives
Mali
Mauritania
Mauritius
Middle East & North Africa
Middle East & North Africa (excluding high income)
Middle East & North Africa (IDA & IBRD countries)
Middle income
Moldova
Mongolia
Montenegro
Morocco
Mozambique
Myanmar
Nepal
Nicaragua
Niger
Nigeria
Oman
Other small states
Pacific island small states
Pakistan
Papua New Guinea
Paraguay
Philippines
Poland
Pre-demographic dividend
Rwanda
Samoa
Sao Tome and Principe
Senegal
Serbia
Seychelles
Sierra Leone
Slovak Republic
Slovenia
Small states
Solomon Islands
Somalia
South Asia
South Asia (IDA & IBRD)
Sri Lanka
St. Kitts and Nevis
St. Lucia
St. Vincent and the Grenadines
Sub-Saharan Africa
Sub-Saharan Africa (excluding high income)
Sub-Saharan Africa (IDA & IBRD countries)
Sudan
Swaziland
Syrian Arab Republic
Tajikistan
Tanzania
Thailand
Togo
Tonga
Trinidad and Tobago
Tunisia
Turkey
Uganda
Upper middle income
Uzbekistan
Vanuatu
Vietnam
Yemen, Rep.
Zambia
Zimbabwe
Timeline:
This timeline shows a graph from
1995
to
2016
of Georgia. No data until
1994
. Number of actual observations by date:
22
.
Source name:
World Development Indicators
Source organization:
World Bank, International Debt Statistics.
Categories, topics:
External Debt
Last updated:
apr 23, 2017
Indicators value changes by year
Meaning:
58.315 mln
Minimum:
-15.731 mln
jan 1, 2016
Maximum:
155.161 mln
jan 1, 2010
At the date of observation
Value
Absolute change
Change from the previous value
jan 1, 1995
971.0K
+971.0K
0.0%
jan 1, 1996
85.059 mln
+84.088 mln
8.66K%
jan 1, 1997
76.337 mln
-8.722 mln
-10.25%
jan 1, 1998
64.25 mln
-12.087 mln
-15.83%
jan 1, 1999
52.902 mln
-11.348 mln
-17.66%
jan 1, 2000
78.839 mln
+25.937 mln
49.03%
jan 1, 2001
18.103 mln
-60.736 mln
-77.04%
jan 1, 2002
63.109 mln
+45.006 mln
248.61%
jan 1, 2003
61.333 mln
-1.776 mln
-2.81%
jan 1, 2004
43.462 mln
-17.871 mln
-29.14%
jan 1, 2005
64.381 mln
+20.919 mln
48.13%
jan 1, 2006
52.092 mln
-12.289 mln
-19.09%
jan 1, 2007
72.344 mln
+20.252 mln
38.88%
jan 1, 2008
65.396 mln
-6.948 mln
-9.6%
jan 1, 2009
110.225 mln
+44.829 mln
68.55%
jan 1, 2010
155.161 mln
+44.936 mln
40.77%
jan 1, 2011
52.878 mln
-102.283 mln
-65.92%
jan 1, 2012
36.645 mln
-16.233 mln
-30.7%
jan 1, 2013
73.403 mln
+36.758 mln
100.31%
jan 1, 2014
51.489 mln
-21.914 mln
-29.85%
jan 1, 2015
20.29 mln
-31.199 mln
-60.59%
jan 1, 2016
-15.731 mln
-36.021 mln
-177.53%
Ranking of countries by current statistics by years
About & Feedback
Terms
Privacy
Library
2024
©
Time.Graphics
Support 24/7
Cabinet
Get premium
Donate
The service accepts bank transfer (ACH, Wire) or cards (Visa, MasterCard, etc). Processed by Stripe.
Secured with SSL
Excellent (Trustpilot Reviews)
Based on 115+ reviews
Write your own review on
Trustpilot.com
