29
/
en
AIzaSyAYiBZKx7MnpbEhh9jyipgxe19OcubqV5w
April 1, 2024
237475
Serbia
SRB
true
2
1
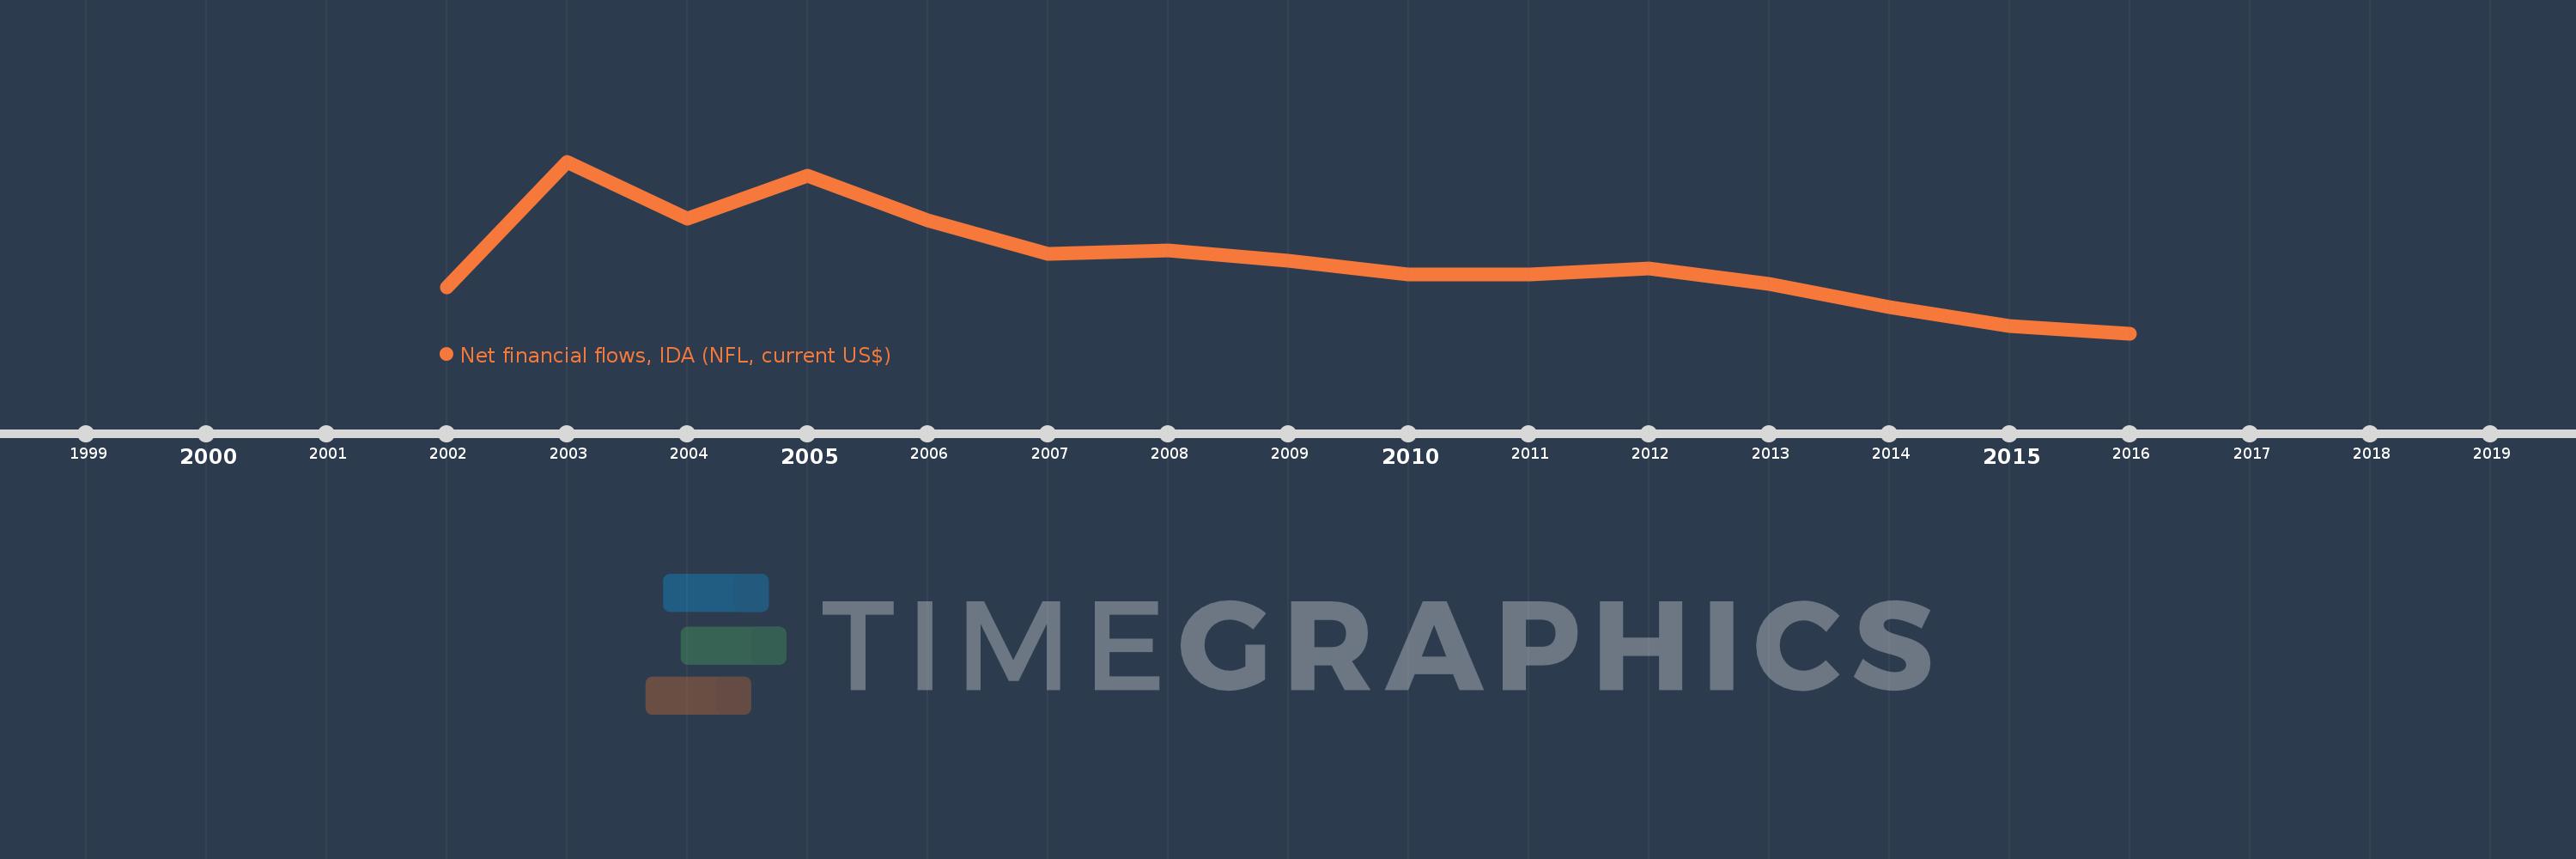
Net financial flows, IDA (NFL, current US$)
2016,2015,2014,2013,2012,2011,2010,2009,2008,2007,2006,2005,2004,2003,2002
This statistics in other country:
Timeline:
This timeline shows a graph from 2002 to 2016 of Serbia. No data until 2001. Number of actual observations by date: 15.
Source name:
World Development Indicators
Source organization:
World Bank, International Debt Statistics.
Categories, topics:
External Debt
Last updated:
apr 23, 2017
Indicators value changes by year
Minimum:
-57.588 mln
jan 1, 2016
Maximum:
159.391 mln
jan 1, 2003
At the date of observation
Value
Absolute change
Change from previous value
jan 1, 2003
159.391 mln
+159.391 mln
%
jan 1, 2004
86.942 mln
-72.449 mln
-45.45%
jan 1, 2005
141.765 mln
+54.823 mln
63.06%
jan 1, 2006
84.637 mln
-57.128 mln
-40.3%
jan 1, 2007
42.542 mln
-42.095 mln
-49.74%
jan 1, 2008
47.376 mln
+4.834 mln
11.36%
jan 1, 2009
34.482 mln
-12.894 mln
-27.22%
jan 1, 2010
16.603 mln
-17.879 mln
-51.85%
jan 1, 2011
16.401 mln
-202.0K
-1.22%
jan 1, 2012
24.075 mln
+7.674 mln
46.79%
jan 1, 2013
5.146 mln
-18.929 mln
-78.63%
jan 1, 2014
-24.644 mln
-29.79 mln
-578.9%
jan 1, 2015
-48.345 mln
-23.701 mln
96.17%
jan 1, 2016
-57.588 mln
-9.243 mln
19.12%
Ranking of countries by current statistics by years


Comments: