29
/
en
AIzaSyAYiBZKx7MnpbEhh9jyipgxe19OcubqV5w
April 1, 2024
272625
Uganda
UGA
true
2
1
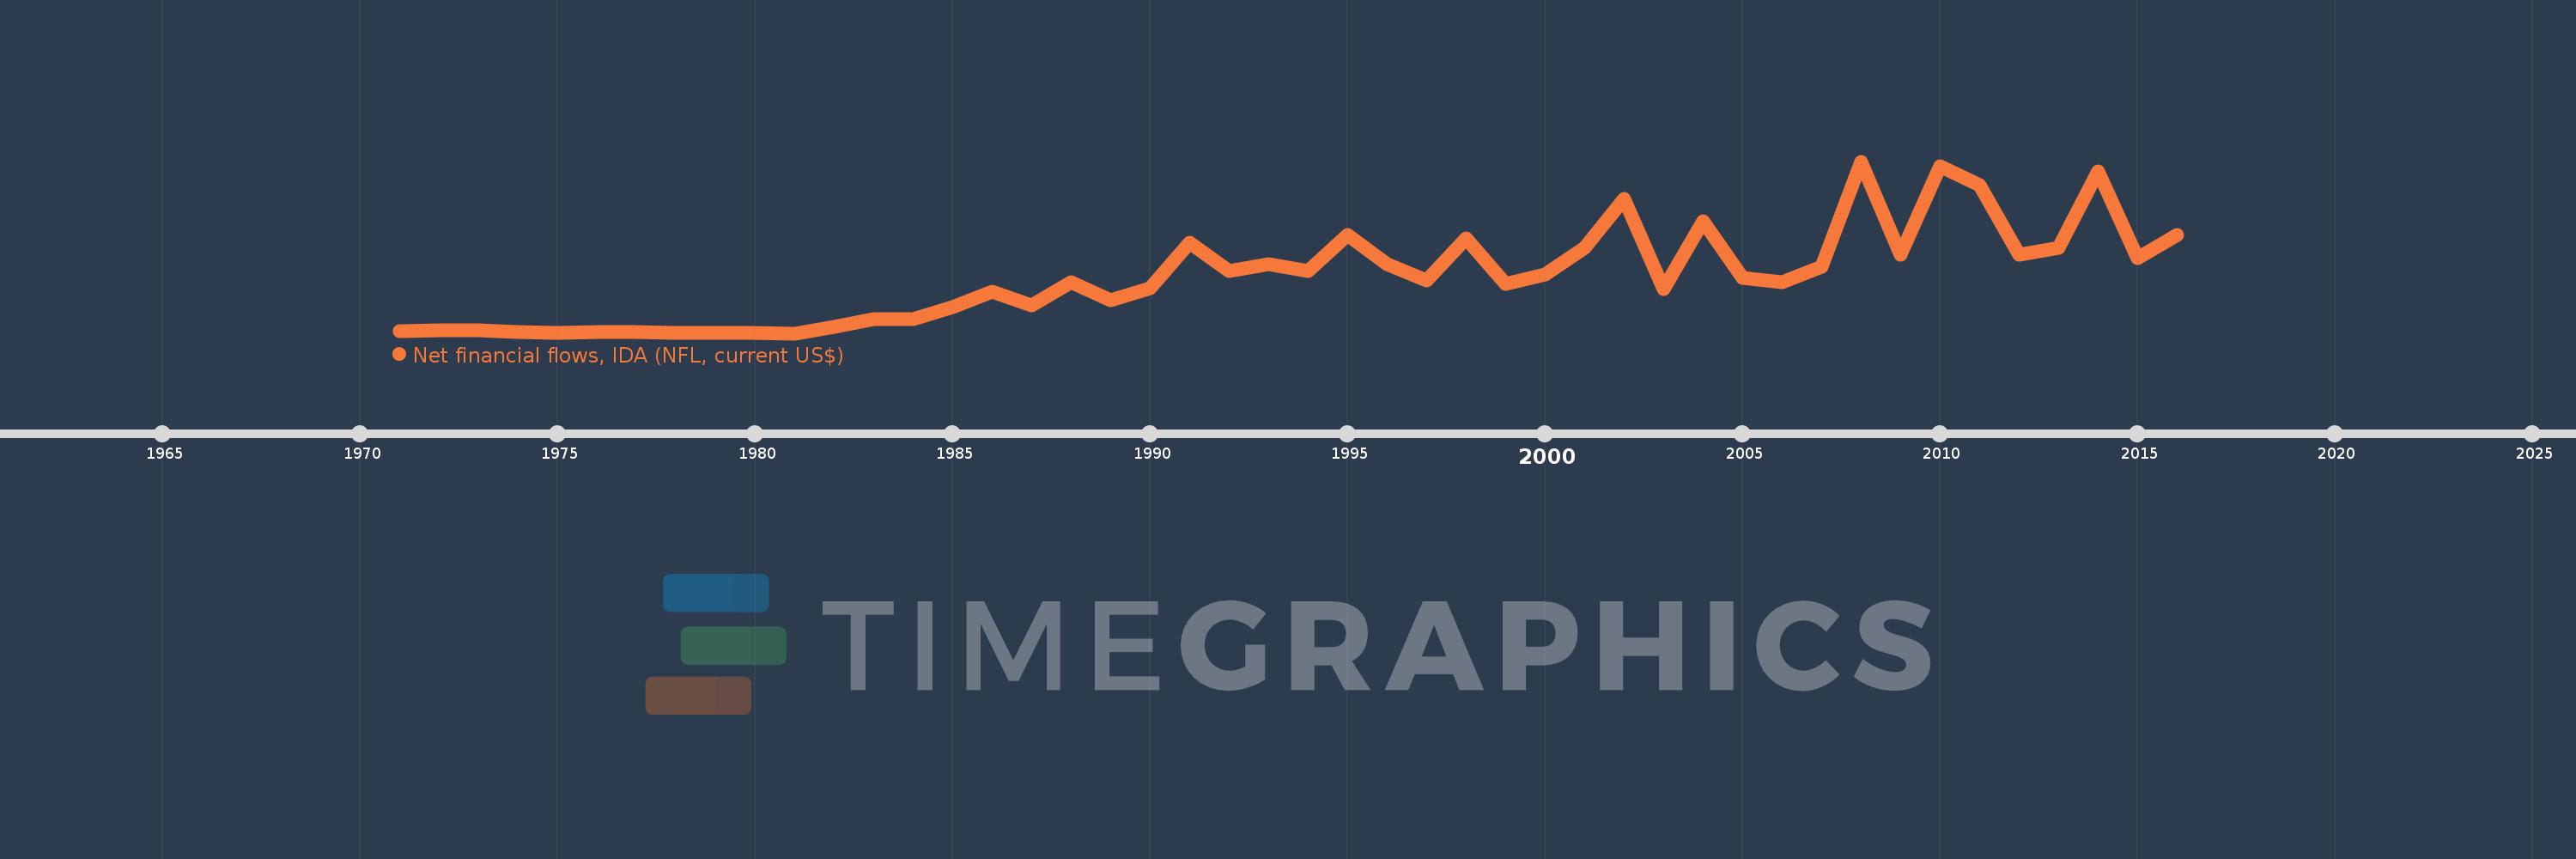
Net financial flows, IDA (NFL, current US$)
2016,2015,2014,2013,2012,2011,2010,2009,2008,2007,2006,2005,2004,2003,2002,2001,2000,1999,1998,1997,1996,1995,1994,1993,1992,1991,1990,1989,1988,1987,1986,1985,1984,1983,1982,1981,1980,1979,1978,1977,1976,1975,1974,1973,1972,1971
This statistics in other country:
Timeline:
This timeline shows a graph from 1971 to 2016 of Uganda. No data until 1970. Number of actual observations by date: 46.
Source name:
World Development Indicators
Source organization:
World Bank, International Debt Statistics.
Categories, topics:
External Debt
Last updated:
apr 23, 2017
Indicators value changes by year
Minimum:
741.0K
jan 1, 1981
Maximum:
373.572 mln
jan 1, 2008
At the date of observation
Value
Absolute change
Change from previous value
jan 1, 1971
5.405 mln
+5.405 mln
0.0%
jan 1, 1972
8.062 mln
+2.657 mln
49.16%
jan 1, 1973
6.337 mln
-1.725 mln
-21.4%
jan 1, 1974
2.684 mln
-3.653 mln
-57.65%
jan 1, 1975
1.164 mln
-1.52 mln
-56.63%
jan 1, 1976
2.758 mln
+1.594 mln
136.94%
jan 1, 1977
2.659 mln
-99.0K
-3.59%
jan 1, 1978
843.0K
-1.816 mln
-68.3%
jan 1, 1979
1.489 mln
+646.0K
76.63%
jan 1, 1980
1.029 mln
-460.0K
-30.89%
jan 1, 1981
741.0K
-288.0K
-27.99%
jan 1, 1982
14.9 mln
+14.159 mln
1.91K%
jan 1, 1983
30.648 mln
+15.748 mln
105.69%
jan 1, 1984
32.1 mln
+1.452 mln
4.74%
jan 1, 1985
57.854 mln
+25.754 mln
80.23%
jan 1, 1986
91.263 mln
+33.409 mln
57.75%
jan 1, 1987
61.583 mln
-29.68 mln
-32.52%
jan 1, 1988
111.267 mln
+49.684 mln
80.68%
jan 1, 1989
73.005 mln
-38.262 mln
-34.39%
jan 1, 1990
97.908 mln
+24.903 mln
34.11%
jan 1, 1991
197.707 mln
+99.799 mln
101.93%
jan 1, 1992
135.235 mln
-62.472 mln
-31.6%
jan 1, 1993
150.859 mln
+15.624 mln
11.55%
jan 1, 1994
135.661 mln
-15.198 mln
-10.07%
jan 1, 1995
214.023 mln
+78.362 mln
57.76%
jan 1, 1996
151.416 mln
-62.607 mln
-29.25%
jan 1, 1997
116.077 mln
-35.339 mln
-23.34%
jan 1, 1998
207.632 mln
+91.555 mln
78.87%
jan 1, 1999
107.707 mln
-99.925 mln
-48.13%
jan 1, 2000
128.225 mln
+20.518 mln
19.05%
jan 1, 2001
187.131 mln
+58.906 mln
45.94%
jan 1, 2002
292.83 mln
+105.699 mln
56.48%
jan 1, 2003
95.815 mln
-197.015 mln
-67.28%
jan 1, 2004
244.405 mln
+148.59 mln
155.08%
jan 1, 2005
120.603 mln
-123.802 mln
-50.65%
jan 1, 2006
111.741 mln
-8.862 mln
-7.35%
jan 1, 2007
145.148 mln
+33.407 mln
29.9%
jan 1, 2008
373.572 mln
+228.424 mln
157.37%
jan 1, 2009
171.762 mln
-201.81 mln
-54.02%
jan 1, 2010
363.311 mln
+191.549 mln
111.52%
jan 1, 2011
322.993 mln
-40.318 mln
-11.1%
jan 1, 2012
171.188 mln
-151.805 mln
-47.0%
jan 1, 2013
186.881 mln
+15.693 mln
9.17%
jan 1, 2014
351.445 mln
+164.564 mln
88.06%
jan 1, 2015
164.572 mln
-186.873 mln
-53.17%
jan 1, 2016
214.198 mln
+49.626 mln
30.15%
Ranking of countries by current statistics by years


Comments: