29
/
en
AIzaSyAYiBZKx7MnpbEhh9jyipgxe19OcubqV5w
April 1, 2024
251095
St. Lucia
LCA
true
2
1
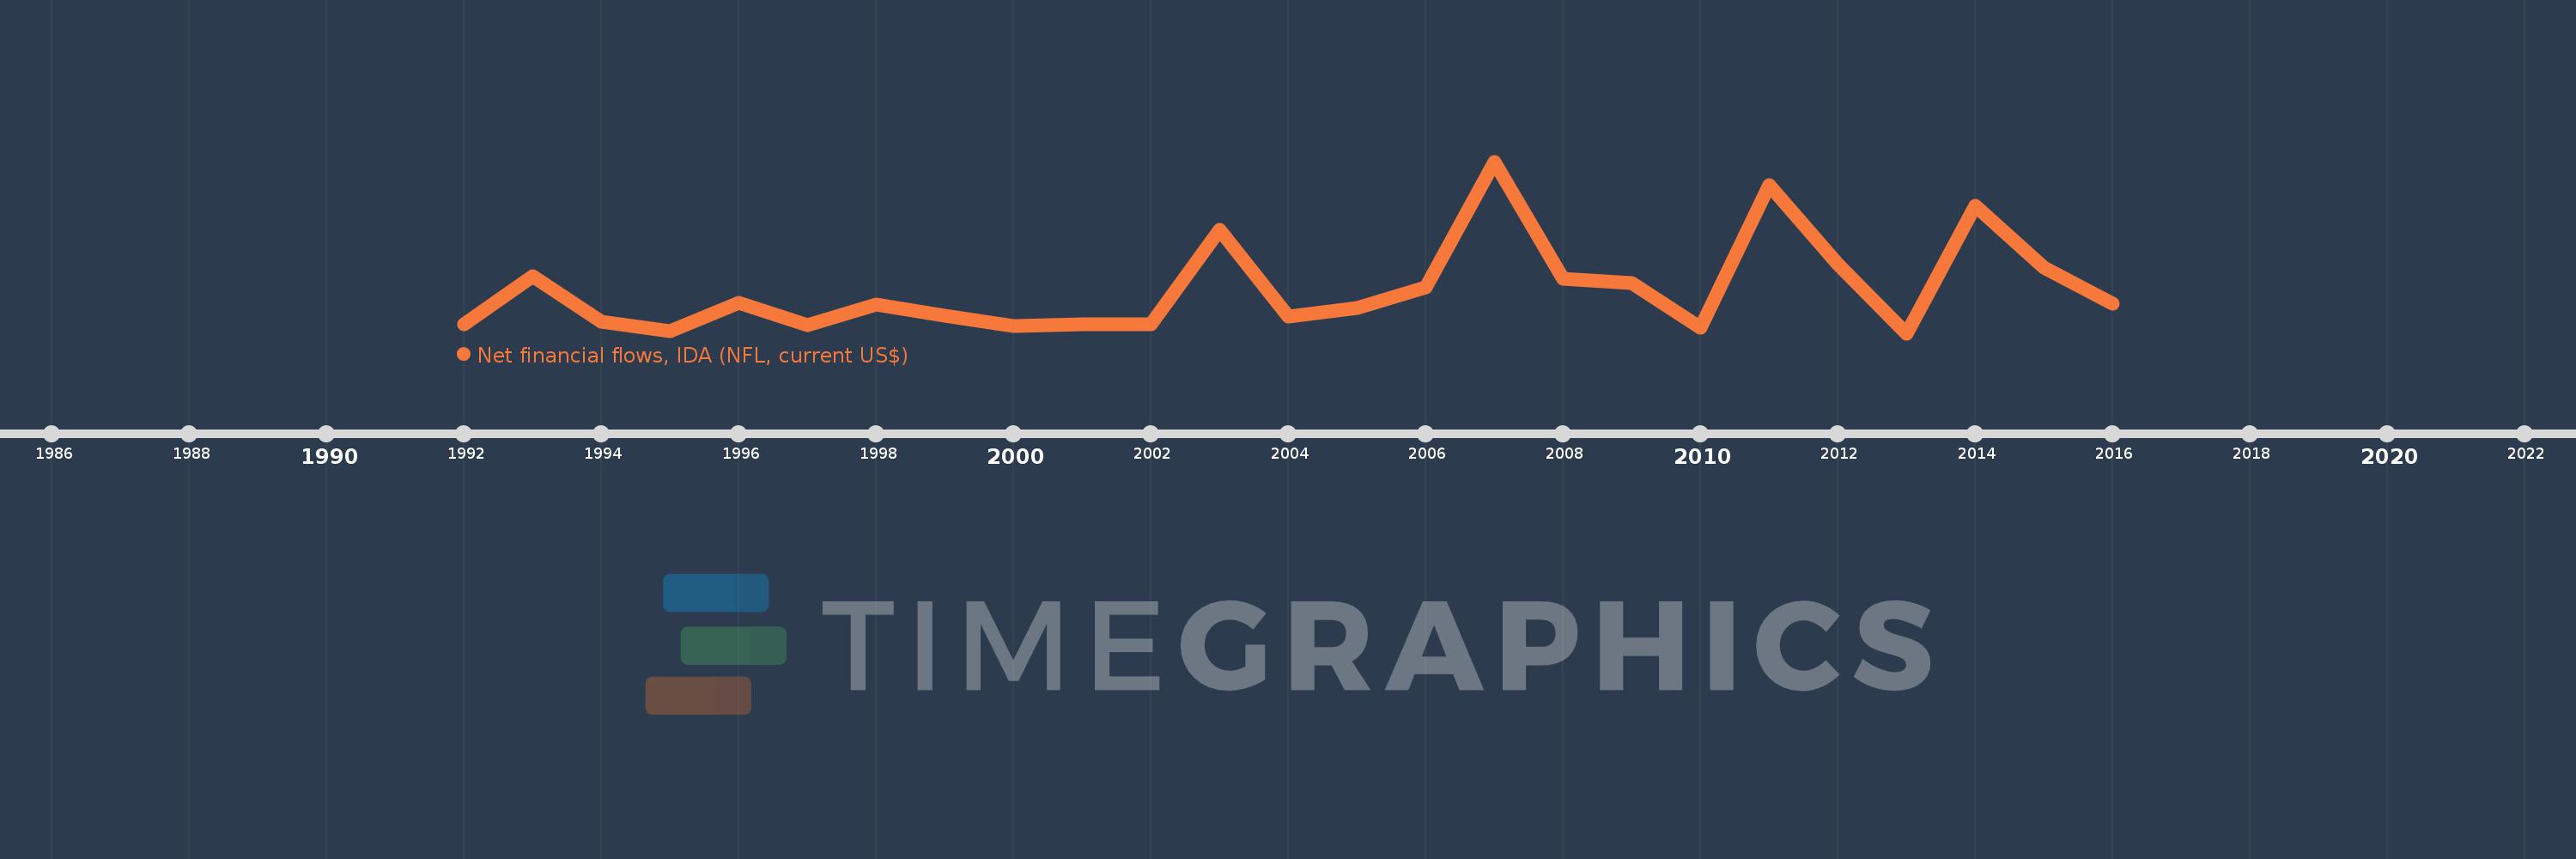
Net financial flows, IDA (NFL, current US$)
2016,2015,2014,2013,2012,2011,2010,2009,2008,2007,2006,2005,2004,2003,2002,2001,2000,1999,1998,1997,1996,1995,1994,1993,1992
This statistics in other country:
Timeline:
This timeline shows a graph from 1992 to 2016 of St. Lucia. No data until 1991. Number of actual observations by date: 25.
Source name:
World Development Indicators
Source organization:
World Bank, International Debt Statistics.
Categories, topics:
External Debt
Last updated:
apr 23, 2017
Indicators value changes by year
Maximum:
11.846 mln
jan 1, 2007
At the date of observation
Value
Absolute change
Change from previous value
jan 1, 1992
599.0K
+599.0K
0.0%
jan 1, 1993
3.953 mln
+3.354 mln
559.93%
jan 1, 1994
829.0K
-3.124 mln
-79.03%
jan 1, 1995
170.0K
-659.0K
-79.49%
jan 1, 1996
2.095 mln
+1.925 mln
1.13K%
jan 1, 1997
567.0K
-1.528 mln
-72.94%
jan 1, 1998
1.976 mln
+1.409 mln
248.5%
jan 1, 1999
1.228 mln
-748.0K
-37.85%
jan 1, 2000
527.0K
-701.0K
-57.08%
jan 1, 2001
598.0K
+71.0K
13.47%
jan 1, 2002
645.0K
+47.0K
7.86%
jan 1, 2003
7.147 mln
+6.502 mln
1.01K%
jan 1, 2004
1.167 mln
-5.98 mln
-83.67%
jan 1, 2005
1.74 mln
+573.0K
49.1%
jan 1, 2006
3.159 mln
+1.419 mln
81.55%
jan 1, 2007
11.846 mln
+8.687 mln
274.99%
jan 1, 2008
3.768 mln
-8.078 mln
-68.19%
jan 1, 2009
3.456 mln
-312.0K
-8.28%
jan 1, 2010
412.0K
-3.044 mln
-88.08%
jan 1, 2011
10.23 mln
+9.818 mln
2.38K%
jan 1, 2012
4.761 mln
-5.469 mln
-53.46%
jan 1, 2013
5.0K
-4.756 mln
-99.89%
jan 1, 2014
8.785 mln
+8.78 mln
175.6K%
jan 1, 2015
4.556 mln
-4.229 mln
-48.14%
jan 1, 2016
2.064 mln
-2.492 mln
-54.7%
Ranking of countries by current statistics by years


Comments: