29
/
en
AIzaSyAYiBZKx7MnpbEhh9jyipgxe19OcubqV5w
April 1, 2024
51201
Middle income
MIC
false
2
1
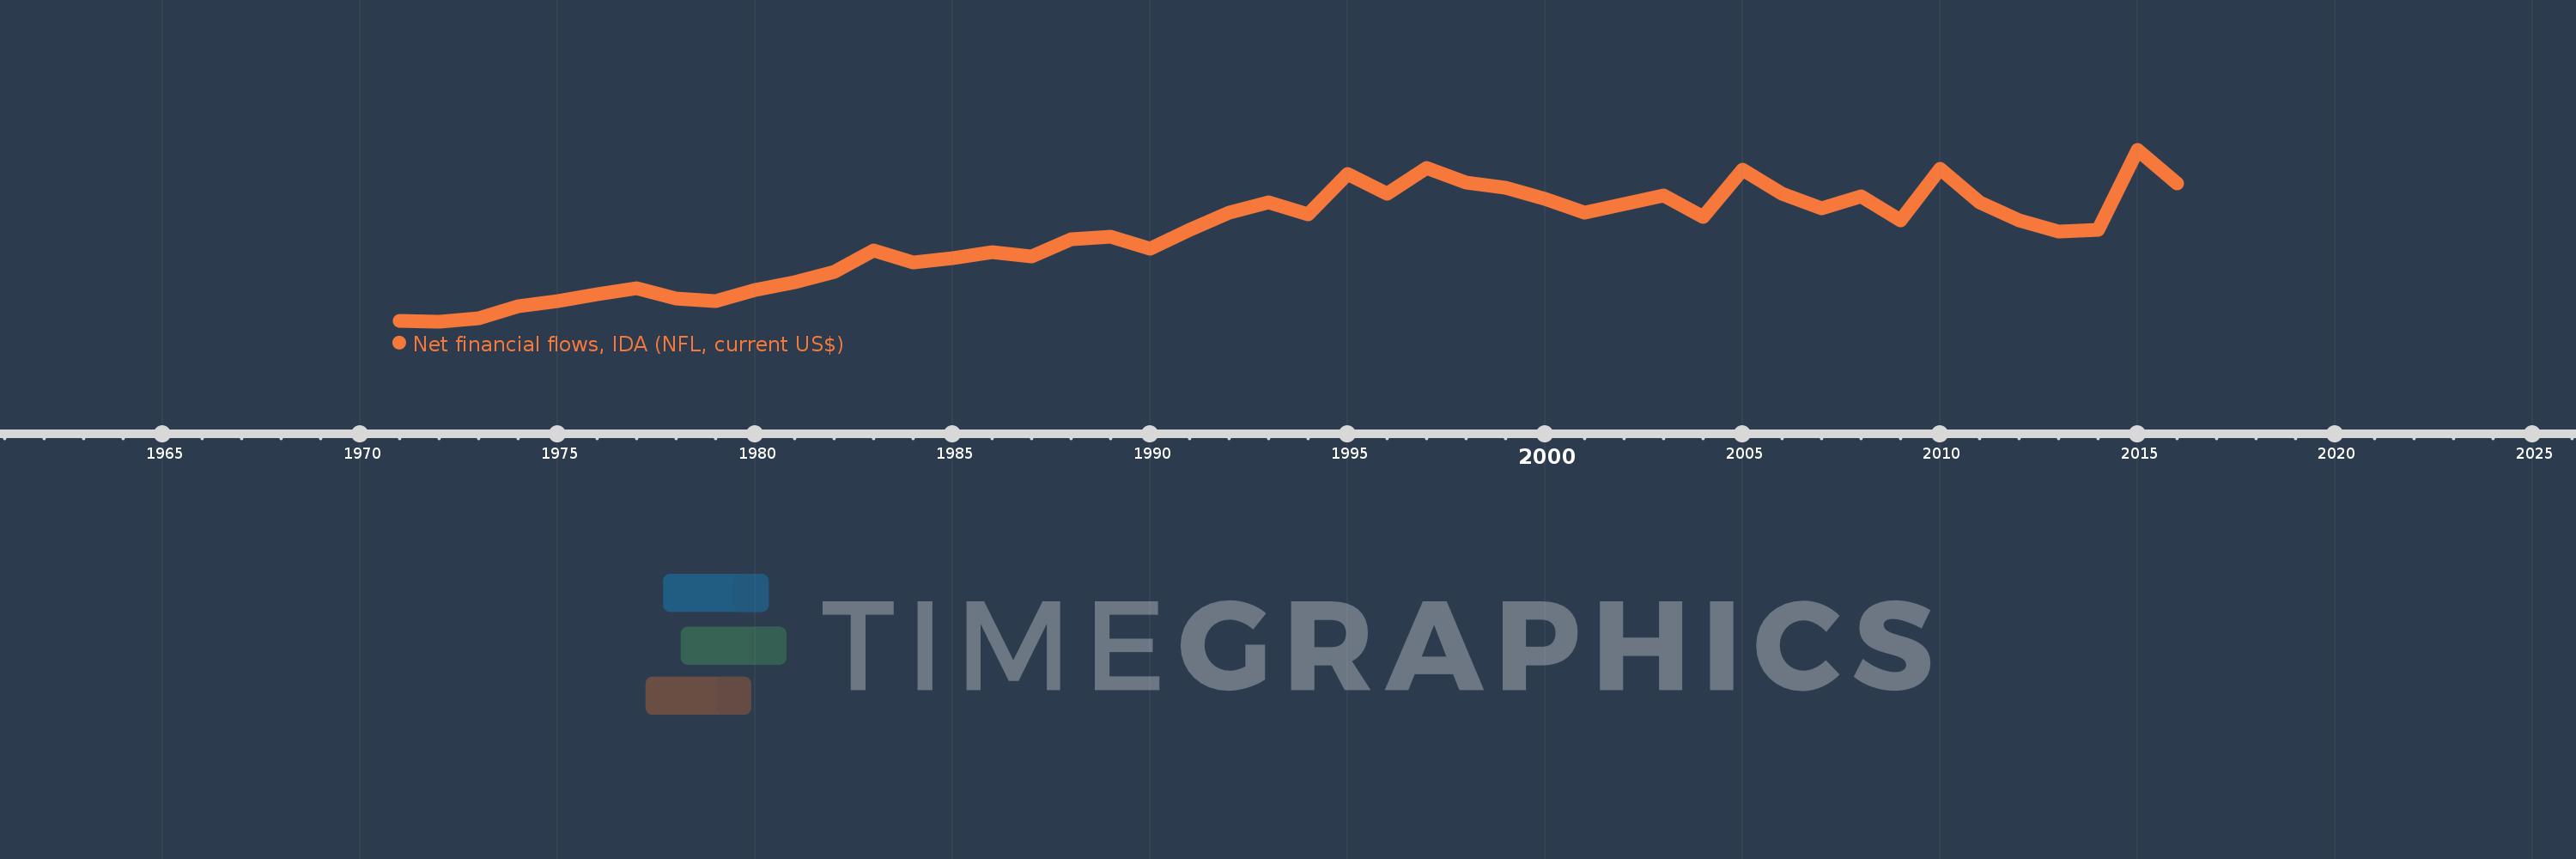
Net financial flows, IDA (NFL, current US$)
2016,2015,2014,2013,2012,2011,2010,2009,2008,2007,2006,2005,2004,2003,2002,2001,2000,1999,1998,1997,1996,1995,1994,1993,1992,1991,1990,1989,1988,1987,1986,1985,1984,1983,1982,1981,1980,1979,1978,1977,1976,1975,1974,1973,1972,1971
This statistics in other country:
Timeline:
This timeline shows a graph from 1971 to 2016 of Middle income. No data until 1970. Number of actual observations by date: 46.
Source name:
World Development Indicators
Source organization:
World Bank, International Debt Statistics.
Categories, topics:
External Debt
Last updated:
apr 23, 2017
Indicators value changes by year
Minimum:
215.055 mln
jan 1, 1972
Maximum:
4.686 bln
jan 1, 2015
At the date of observation
Value
Absolute change
Change from previous value
jan 1, 1971
243.28 mln
+243.28 mln
0.0%
jan 1, 1972
215.055 mln
-28.225 mln
-11.6%
jan 1, 1973
319.594 mln
+104.539 mln
48.61%
jan 1, 1974
618.078 mln
+298.484 mln
93.39%
jan 1, 1975
747.917 mln
+129.839 mln
21.01%
jan 1, 1976
939.701 mln
+191.784 mln
25.64%
jan 1, 1977
1.092 bln
+152.655 mln
16.25%
jan 1, 1978
823.449 mln
-268.907 mln
-24.62%
jan 1, 1979
767.431 mln
-56.018 mln
-6.8%
jan 1, 1980
1.055 bln
+287.192 mln
37.42%
jan 1, 1981
1.242 bln
+186.96 mln
17.73%
jan 1, 1982
1.526 bln
+284.127 mln
22.88%
jan 1, 1983
2.075 bln
+549.357 mln
36.01%
jan 1, 1984
1.775 bln
-300.46 mln
-14.48%
jan 1, 1985
1.881 bln
+106.705 mln
6.01%
jan 1, 1986
2.04 bln
+158.597 mln
8.43%
jan 1, 1987
1.928 bln
-111.783 mln
-5.48%
jan 1, 1988
2.375 bln
+447.329 mln
23.2%
jan 1, 1989
2.434 bln
+58.149 mln
2.45%
jan 1, 1990
2.13 bln
-303.859 mln
-12.49%
jan 1, 1991
2.624 bln
+493.929 mln
23.19%
jan 1, 1992
3.055 bln
+431.303 mln
16.44%
jan 1, 1993
3.326 bln
+270.808 mln
8.86%
jan 1, 1994
3.008 bln
-318.173 mln
-9.57%
jan 1, 1995
4.058 bln
+1.05 bln
34.92%
jan 1, 1996
3.556 bln
-501.822 mln
-12.37%
jan 1, 1997
4.222 bln
+665.792 mln
18.72%
jan 1, 1998
3.845 bln
-376.941 mln
-8.93%
jan 1, 1999
3.705 bln
-139.914 mln
-3.64%
jan 1, 2000
3.423 bln
-282.308 mln
-7.62%
jan 1, 2001
3.063 bln
-359.234 mln
-10.5%
jan 1, 2002
3.279 bln
+215.758 mln
7.04%
jan 1, 2003
3.516 bln
+236.519 mln
7.21%
jan 1, 2004
2.951 bln
-564.528 mln
-16.06%
jan 1, 2005
4.18 bln
+1.229 bln
41.65%
jan 1, 2006
3.549 bln
-631.613 mln
-15.11%
jan 1, 2007
3.169 bln
-379.976 mln
-10.71%
jan 1, 2008
3.486 bln
+317.673 mln
10.03%
jan 1, 2009
2.862 bln
-624.887 mln
-17.92%
jan 1, 2010
4.209 bln
+1.348 bln
47.09%
jan 1, 2011
3.324 bln
-885.396 mln
-21.04%
jan 1, 2012
2.851 bln
-472.248 mln
-14.21%
jan 1, 2013
2.564 bln
-287.101 mln
-10.07%
jan 1, 2014
2.61 bln
+45.603 mln
1.78%
jan 1, 2015
4.686 bln
+2.076 bln
79.55%
jan 1, 2016
3.82 bln
-866.129 mln
-18.48%
Ranking of countries by current statistics by years


Comments: