29
/
en
AIzaSyAYiBZKx7MnpbEhh9jyipgxe19OcubqV5w
April 1, 2024
34454
Fragile and conflict affected situations
FCS
false
2
1
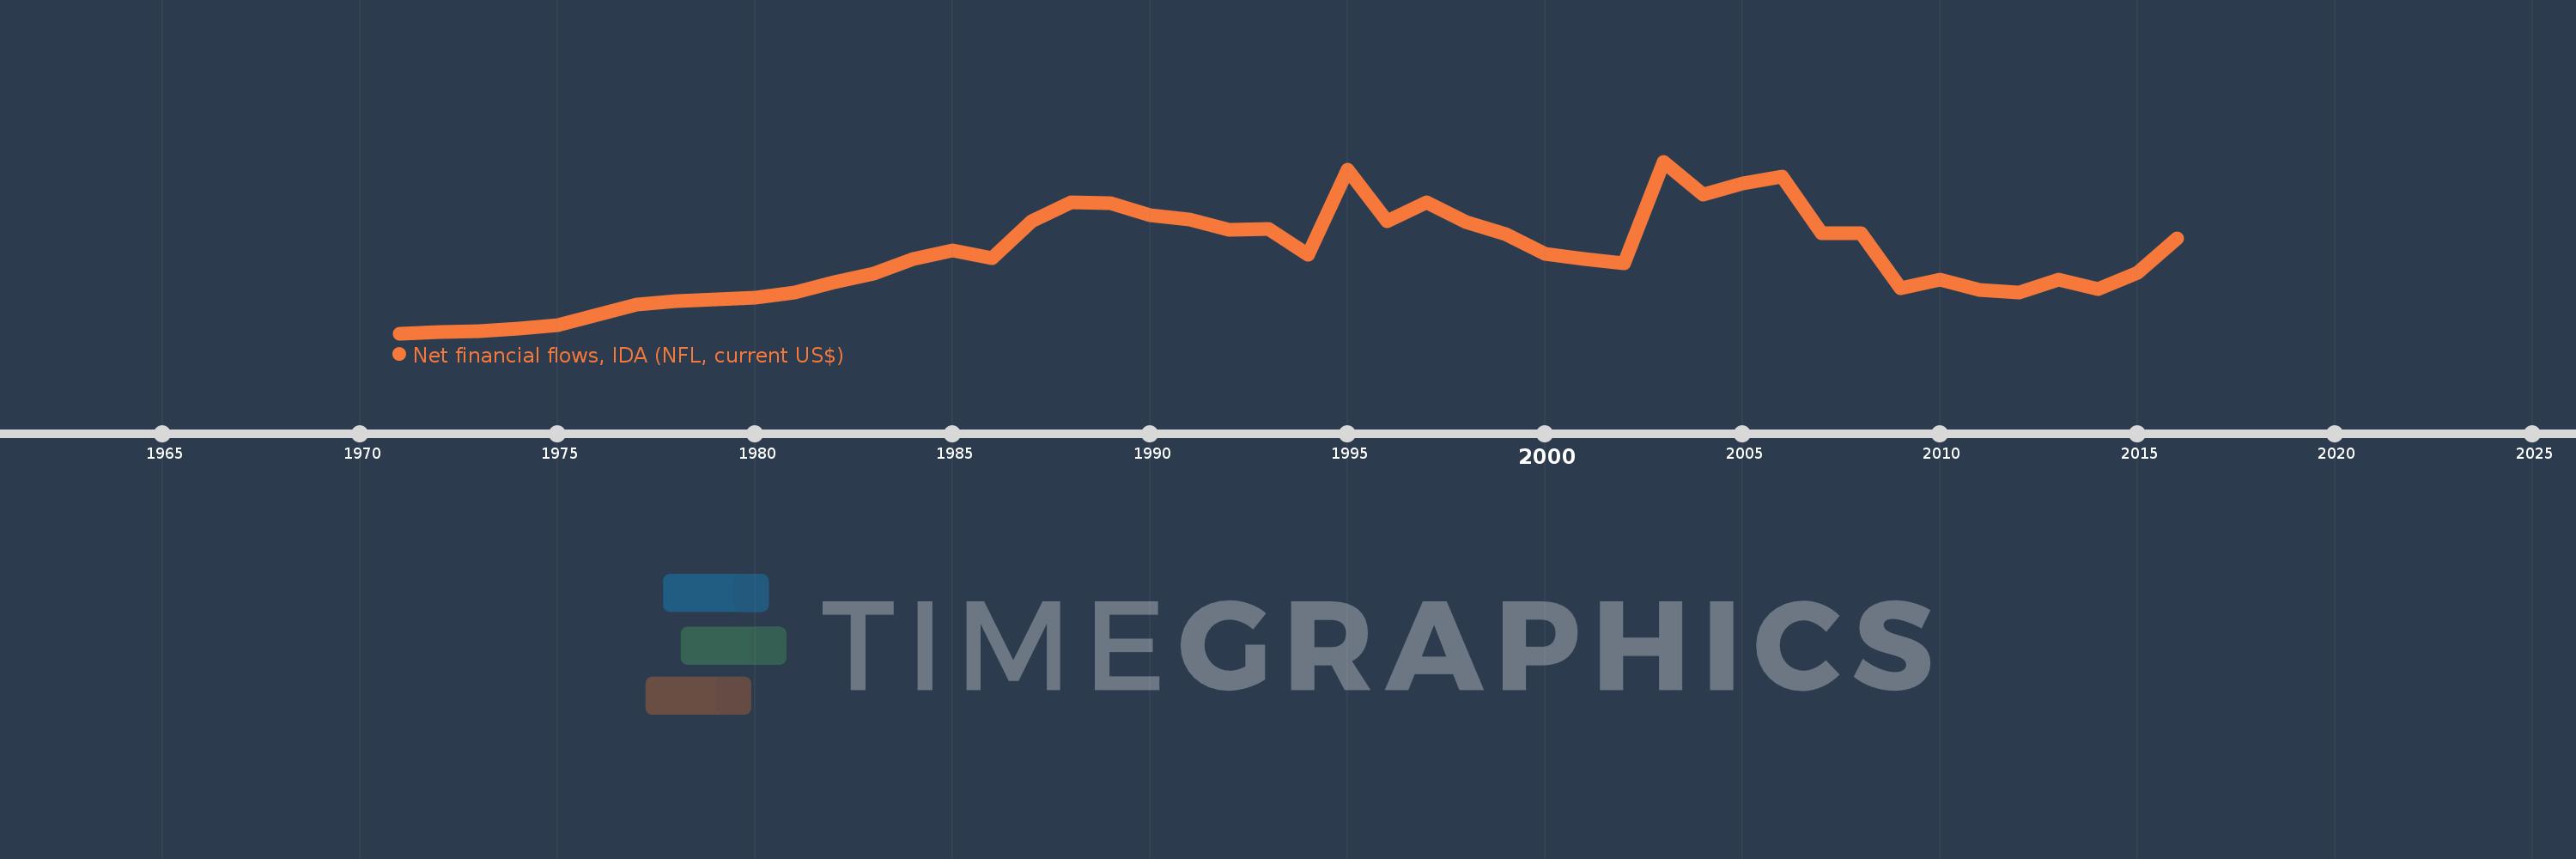
Net financial flows, IDA (NFL, current US$)
2016,2015,2014,2013,2012,2011,2010,2009,2008,2007,2006,2005,2004,2003,2002,2001,2000,1999,1998,1997,1996,1995,1994,1993,1992,1991,1990,1989,1988,1987,1986,1985,1984,1983,1982,1981,1980,1979,1978,1977,1976,1975,1974,1973,1972,1971
This statistics in other country:
Timeline:
This timeline shows a graph from 1971 to 2016 of Fragile and conflict affected situations. No data until 1970. Number of actual observations by date: 46.
Source name:
World Development Indicators
Source organization:
World Bank, International Debt Statistics.
Categories, topics:
External Debt
Last updated:
apr 23, 2017
Indicators value changes by year
Minimum:
12.458 mln
jan 1, 1971
Maximum:
978.172 mln
jan 1, 2003
At the date of observation
Value
Absolute change
Change from previous value
jan 1, 1971
12.458 mln
+12.458 mln
0.0%
jan 1, 1972
20.774 mln
+8.316 mln
66.75%
jan 1, 1973
26.372 mln
+5.598 mln
26.95%
jan 1, 1974
38.455 mln
+12.083 mln
45.82%
jan 1, 1975
59.32 mln
+20.865 mln
54.26%
jan 1, 1976
114.895 mln
+55.575 mln
93.69%
jan 1, 1977
173.642 mln
+58.747 mln
51.13%
jan 1, 1978
193.269 mln
+19.627 mln
11.3%
jan 1, 1979
201.655 mln
+8.386 mln
4.34%
jan 1, 1980
211.463 mln
+9.808 mln
4.86%
jan 1, 1981
239.836 mln
+28.373 mln
13.42%
jan 1, 1982
302.172 mln
+62.336 mln
25.99%
jan 1, 1983
349.219 mln
+47.047 mln
15.57%
jan 1, 1984
429.164 mln
+79.945 mln
22.89%
jan 1, 1985
477.024 mln
+47.86 mln
11.15%
jan 1, 1986
437.327 mln
-39.697 mln
-8.32%
jan 1, 1987
641.734 mln
+204.407 mln
46.74%
jan 1, 1988
748.528 mln
+106.794 mln
16.64%
jan 1, 1989
743.119 mln
-5.409 mln
-0.72%
jan 1, 1990
676.161 mln
-66.958 mln
-9.01%
jan 1, 1991
652.935 mln
-23.226 mln
-3.43%
jan 1, 1992
592.714 mln
-60.221 mln
-9.22%
jan 1, 1993
599.386 mln
+6.672 mln
1.13%
jan 1, 1994
452.572 mln
-146.814 mln
-24.49%
jan 1, 1995
932.396 mln
+479.824 mln
106.02%
jan 1, 1996
643.922 mln
-288.474 mln
-30.94%
jan 1, 1997
750.788 mln
+106.866 mln
16.6%
jan 1, 1998
639.542 mln
-111.246 mln
-14.82%
jan 1, 1999
568.975 mln
-70.567 mln
-11.03%
jan 1, 2000
458.518 mln
-110.457 mln
-19.41%
jan 1, 2001
427.86 mln
-30.658 mln
-6.69%
jan 1, 2002
403.587 mln
-24.273 mln
-5.67%
jan 1, 2003
978.172 mln
+574.585 mln
142.37%
jan 1, 2004
790.928 mln
-187.244 mln
-19.14%
jan 1, 2005
856.489 mln
+65.561 mln
8.29%
jan 1, 2006
893.386 mln
+36.897 mln
4.31%
jan 1, 2007
573.285 mln
-320.101 mln
-35.83%
jan 1, 2008
575.448 mln
+2.163 mln
0.38%
jan 1, 2009
264.427 mln
-311.021 mln
-54.05%
jan 1, 2010
314.463 mln
+50.036 mln
18.92%
jan 1, 2011
258.144 mln
-56.319 mln
-17.91%
jan 1, 2012
242.759 mln
-15.385 mln
-5.96%
jan 1, 2013
315.249 mln
+72.49 mln
29.86%
jan 1, 2014
260.003 mln
-55.246 mln
-17.52%
jan 1, 2015
355.113 mln
+95.11 mln
36.58%
jan 1, 2016
547.385 mln
+192.272 mln
54.14%
Ranking of countries by current statistics by years


Comments: