29
/
en
AIzaSyAYiBZKx7MnpbEhh9jyipgxe19OcubqV5w
April 1, 2024
122506
Dominican Republic
DOM
true
2
1
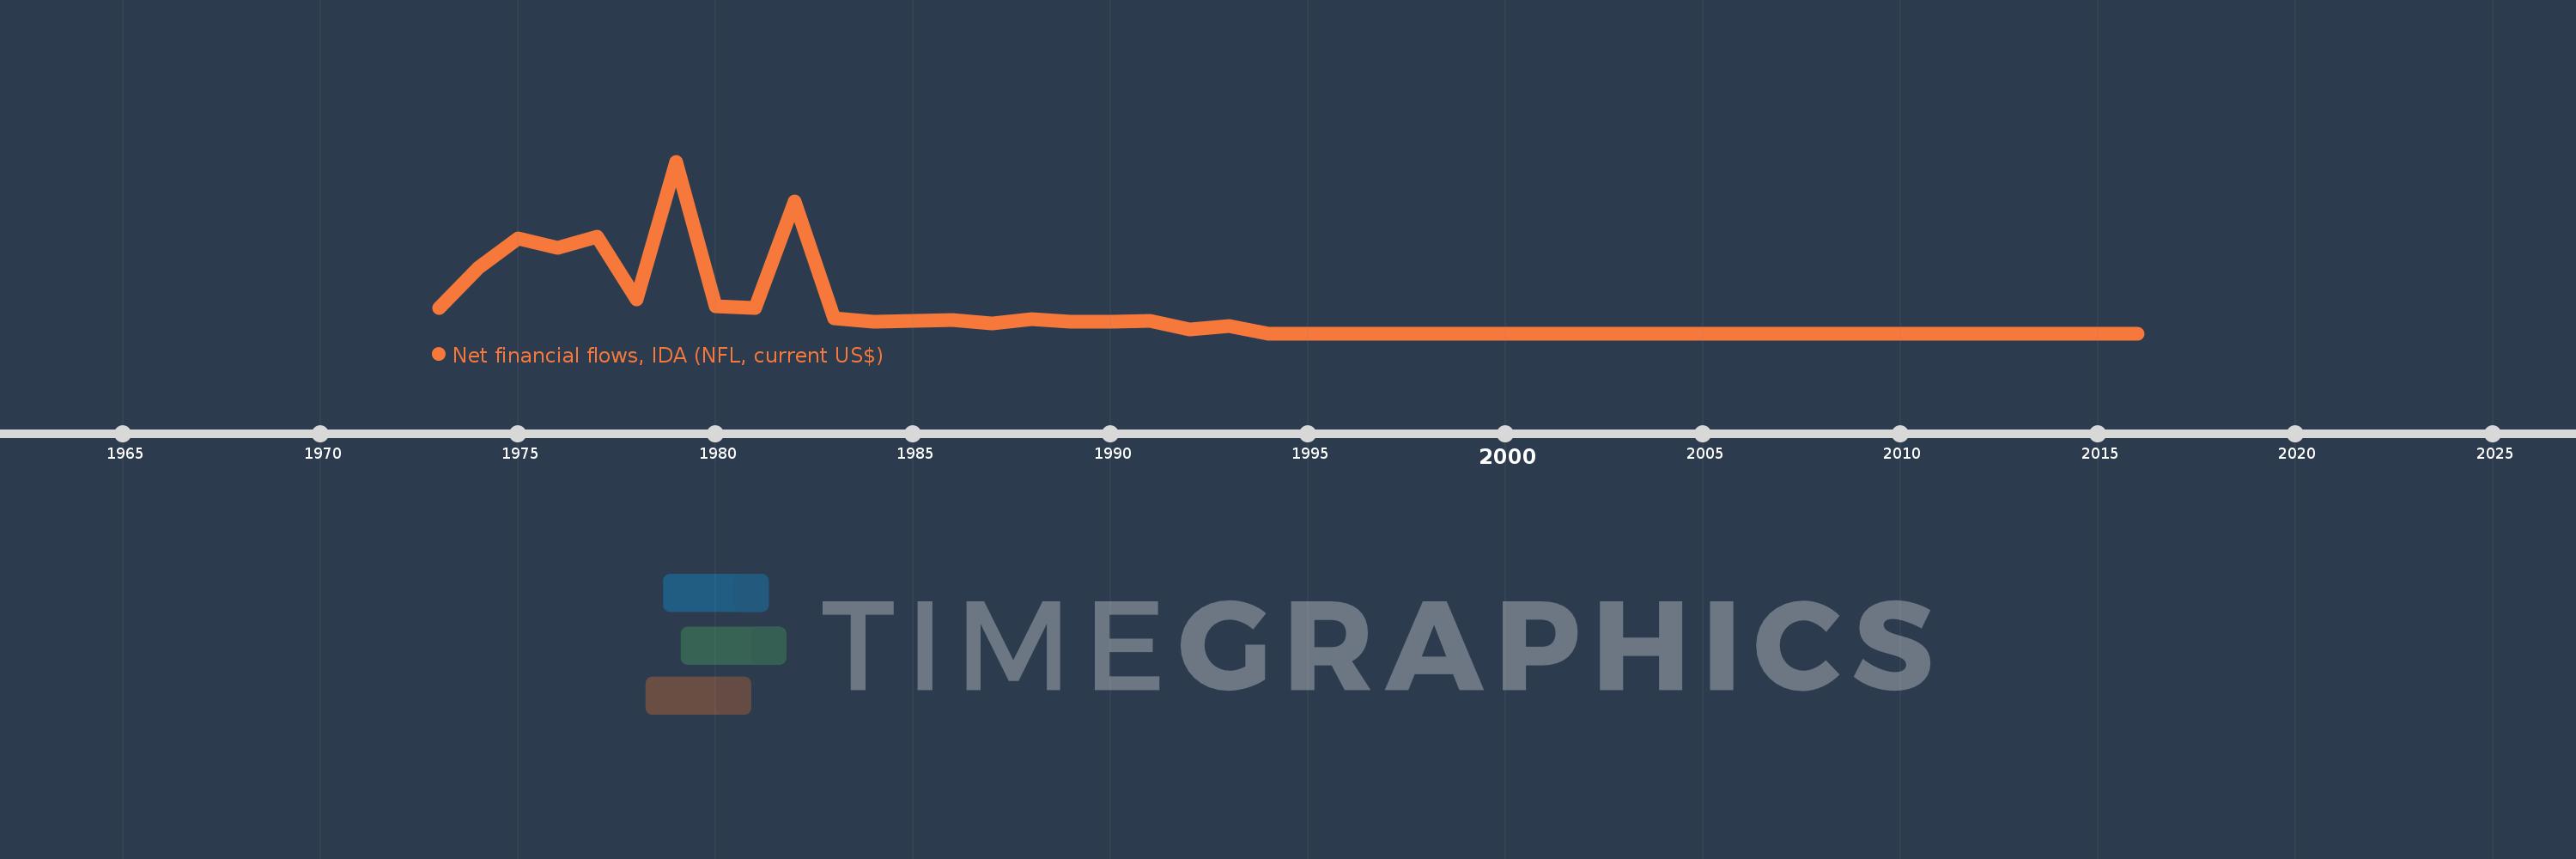
Net financial flows, IDA (NFL, current US$)
2016,2015,2014,2013,2012,2011,2010,2009,2008,2007,2006,2005,2004,2003,2002,2001,2000,1999,1998,1997,1996,1995,1994,1993,1992,1991,1990,1989,1988,1987,1986,1985,1984,1983,1982,1981,1980,1979,1978,1977,1976,1975,1974,1973
This statistics in other country:
Timeline:
This timeline shows a graph from 1973 to 2016 of Dominican Republic. No data until 1972. Number of actual observations by date: 44.
Source name:
World Development Indicators
Source organization:
World Bank, International Debt Statistics.
Categories, topics:
External Debt
Last updated:
apr 23, 2017
Indicators value changes by year
Minimum:
-662.0K
jan 1, 1994
Maximum:
5.803 mln
jan 1, 1979
At the date of observation
Value
Absolute change
Change from previous value
jan 1, 1973
284.0K
+284.0K
0.0%
jan 1, 1974
1.82 mln
+1.536 mln
540.85%
jan 1, 1975
2.899 mln
+1.079 mln
59.29%
jan 1, 1976
2.562 mln
-337.0K
-11.62%
jan 1, 1977
2.972 mln
+410.0K
16.0%
jan 1, 1978
611.0K
-2.361 mln
-79.44%
jan 1, 1979
5.803 mln
+5.192 mln
849.75%
jan 1, 1980
367.0K
-5.436 mln
-93.68%
jan 1, 1981
307.0K
-60.0K
-16.35%
jan 1, 1982
4.284 mln
+3.977 mln
1.3K%
jan 1, 1983
-91.0K
-4.375 mln
-102.12%
jan 1, 1984
-221.0K
-130.0K
142.86%
jan 1, 1985
-201.0K
+20.0K
-9.05%
jan 1, 1986
-176.0K
+25.0K
-12.44%
jan 1, 1987
-285.0K
-109.0K
61.93%
jan 1, 1988
-130.0K
+155.0K
-54.39%
jan 1, 1989
-221.0K
-91.0K
70.0%
jan 1, 1990
-221.0K
0.0
0.0%
jan 1, 1991
-201.0K
+20.0K
-9.05%
jan 1, 1992
-513.0K
-312.0K
155.22%
jan 1, 1993
-402.0K
+111.0K
-21.64%
jan 1, 1994
-662.0K
-260.0K
64.68%
jan 1, 1995
-662.0K
0.0
0.0%
jan 1, 1996
-662.0K
0.0
0.0%
jan 1, 1997
-662.0K
0.0
0.0%
jan 1, 1998
-662.0K
0.0
0.0%
jan 1, 1999
-662.0K
0.0
0.0%
jan 1, 2000
-662.0K
0.0
0.0%
jan 1, 2001
-662.0K
0.0
0.0%
jan 1, 2002
-662.0K
0.0
0.0%
jan 1, 2003
-662.0K
0.0
0.0%
jan 1, 2004
-662.0K
0.0
0.0%
jan 1, 2005
-662.0K
0.0
0.0%
jan 1, 2006
-662.0K
0.0
0.0%
jan 1, 2007
-662.0K
0.0
0.0%
jan 1, 2008
-662.0K
0.0
0.0%
jan 1, 2009
-662.0K
0.0
0.0%
jan 1, 2010
-662.0K
0.0
0.0%
jan 1, 2011
-662.0K
0.0
0.0%
jan 1, 2012
-662.0K
0.0
0.0%
jan 1, 2013
-662.0K
0.0
0.0%
jan 1, 2014
-662.0K
0.0
0.0%
jan 1, 2015
-662.0K
0.0
0.0%
jan 1, 2016
-662.0K
0.0
0.0%
Ranking of countries by current statistics by years


Comments: