29
/
en
AIzaSyAYiBZKx7MnpbEhh9jyipgxe19OcubqV5w
April 1, 2024
261275
Tanzania
TZA
true
2
1
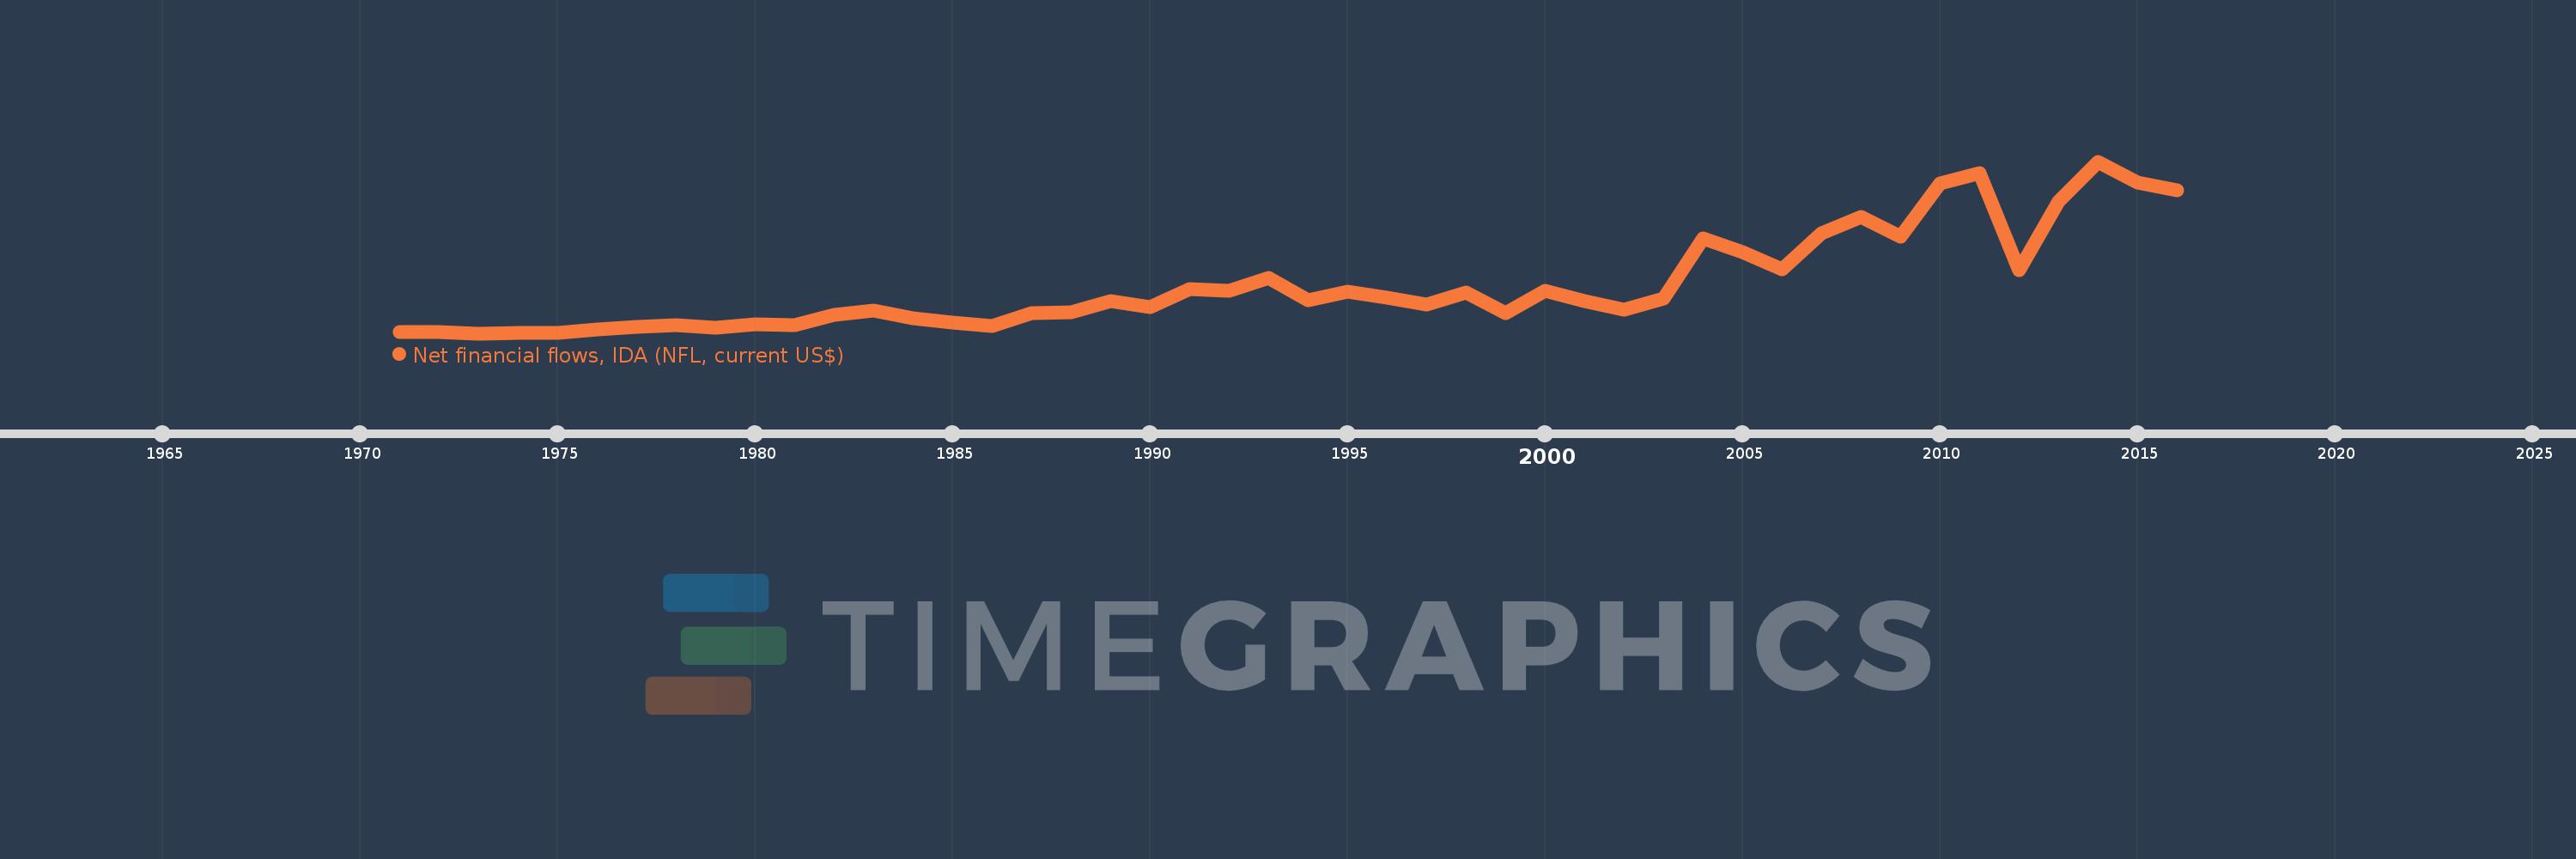
Net financial flows, IDA (NFL, current US$)
2016,2015,2014,2013,2012,2011,2010,2009,2008,2007,2006,2005,2004,2003,2002,2001,2000,1999,1998,1997,1996,1995,1994,1993,1992,1991,1990,1989,1988,1987,1986,1985,1984,1983,1982,1981,1980,1979,1978,1977,1976,1975,1974,1973,1972,1971
This statistics in other country:
Timeline:
This timeline shows a graph from 1971 to 2016 of Tanzania. No data until 1970. Number of actual observations by date: 46.
Source name:
World Development Indicators
Source organization:
World Bank, International Debt Statistics.
Categories, topics:
External Debt
Last updated:
apr 23, 2017
Indicators value changes by year
Minimum:
2.731 mln
jan 1, 1973
Maximum:
697.094 mln
jan 1, 2014
At the date of observation
Value
Absolute change
Change from previous value
jan 1, 1971
9.419 mln
+9.419 mln
0.0%
jan 1, 1972
8.078 mln
-1.341 mln
-14.24%
jan 1, 1973
2.731 mln
-5.347 mln
-66.19%
jan 1, 1974
3.026 mln
+295.0K
10.8%
jan 1, 1975
5.674 mln
+2.648 mln
87.51%
jan 1, 1976
17.475 mln
+11.801 mln
207.98%
jan 1, 1977
28.157 mln
+10.682 mln
61.13%
jan 1, 1978
36.378 mln
+8.221 mln
29.2%
jan 1, 1979
24.006 mln
-12.372 mln
-34.01%
jan 1, 1980
38.4 mln
+14.394 mln
59.96%
jan 1, 1981
34.416 mln
-3.984 mln
-10.38%
jan 1, 1982
76.867 mln
+42.451 mln
123.35%
jan 1, 1983
95.805 mln
+18.938 mln
24.64%
jan 1, 1984
64.145 mln
-31.66 mln
-33.05%
jan 1, 1985
47.441 mln
-16.704 mln
-26.04%
jan 1, 1986
31.793 mln
-15.648 mln
-32.98%
jan 1, 1987
82.605 mln
+50.812 mln
159.82%
jan 1, 1988
86.575 mln
+3.97 mln
4.81%
jan 1, 1989
131.436 mln
+44.861 mln
51.82%
jan 1, 1990
109.94 mln
-21.496 mln
-16.35%
jan 1, 1991
180.54 mln
+70.6 mln
64.22%
jan 1, 1992
173.592 mln
-6.948 mln
-3.85%
jan 1, 1993
226.101 mln
+52.509 mln
30.25%
jan 1, 1994
136.874 mln
-89.227 mln
-39.46%
jan 1, 1995
172.288 mln
+35.414 mln
25.87%
jan 1, 1996
147.777 mln
-24.511 mln
-14.23%
jan 1, 1997
120.525 mln
-27.252 mln
-18.44%
jan 1, 1998
167.492 mln
+46.967 mln
38.97%
jan 1, 1999
84.712 mln
-82.78 mln
-49.42%
jan 1, 2000
174.879 mln
+90.167 mln
106.44%
jan 1, 2001
133.281 mln
-41.598 mln
-23.79%
jan 1, 2002
99.557 mln
-33.724 mln
-25.3%
jan 1, 2003
142.788 mln
+43.231 mln
43.42%
jan 1, 2004
387.353 mln
+244.565 mln
171.28%
jan 1, 2005
329.884 mln
-57.469 mln
-14.84%
jan 1, 2006
260.513 mln
-69.371 mln
-21.03%
jan 1, 2007
408.758 mln
+148.245 mln
56.91%
jan 1, 2008
474.371 mln
+65.613 mln
16.05%
jan 1, 2009
392.868 mln
-81.503 mln
-17.18%
jan 1, 2010
607.584 mln
+214.716 mln
54.65%
jan 1, 2011
649.964 mln
+42.38 mln
6.98%
jan 1, 2012
258.332 mln
-391.632 mln
-60.25%
jan 1, 2013
535.284 mln
+276.952 mln
107.21%
jan 1, 2014
697.094 mln
+161.81 mln
30.23%
jan 1, 2015
613.695 mln
-83.399 mln
-11.96%
jan 1, 2016
582.13 mln
-31.565 mln
-5.14%
Ranking of countries by current statistics by years


Comments: