29
/
en
AIzaSyAYiBZKx7MnpbEhh9jyipgxe19OcubqV5w
April 1, 2024
243907
Solomon Islands
SLB
true
2
1
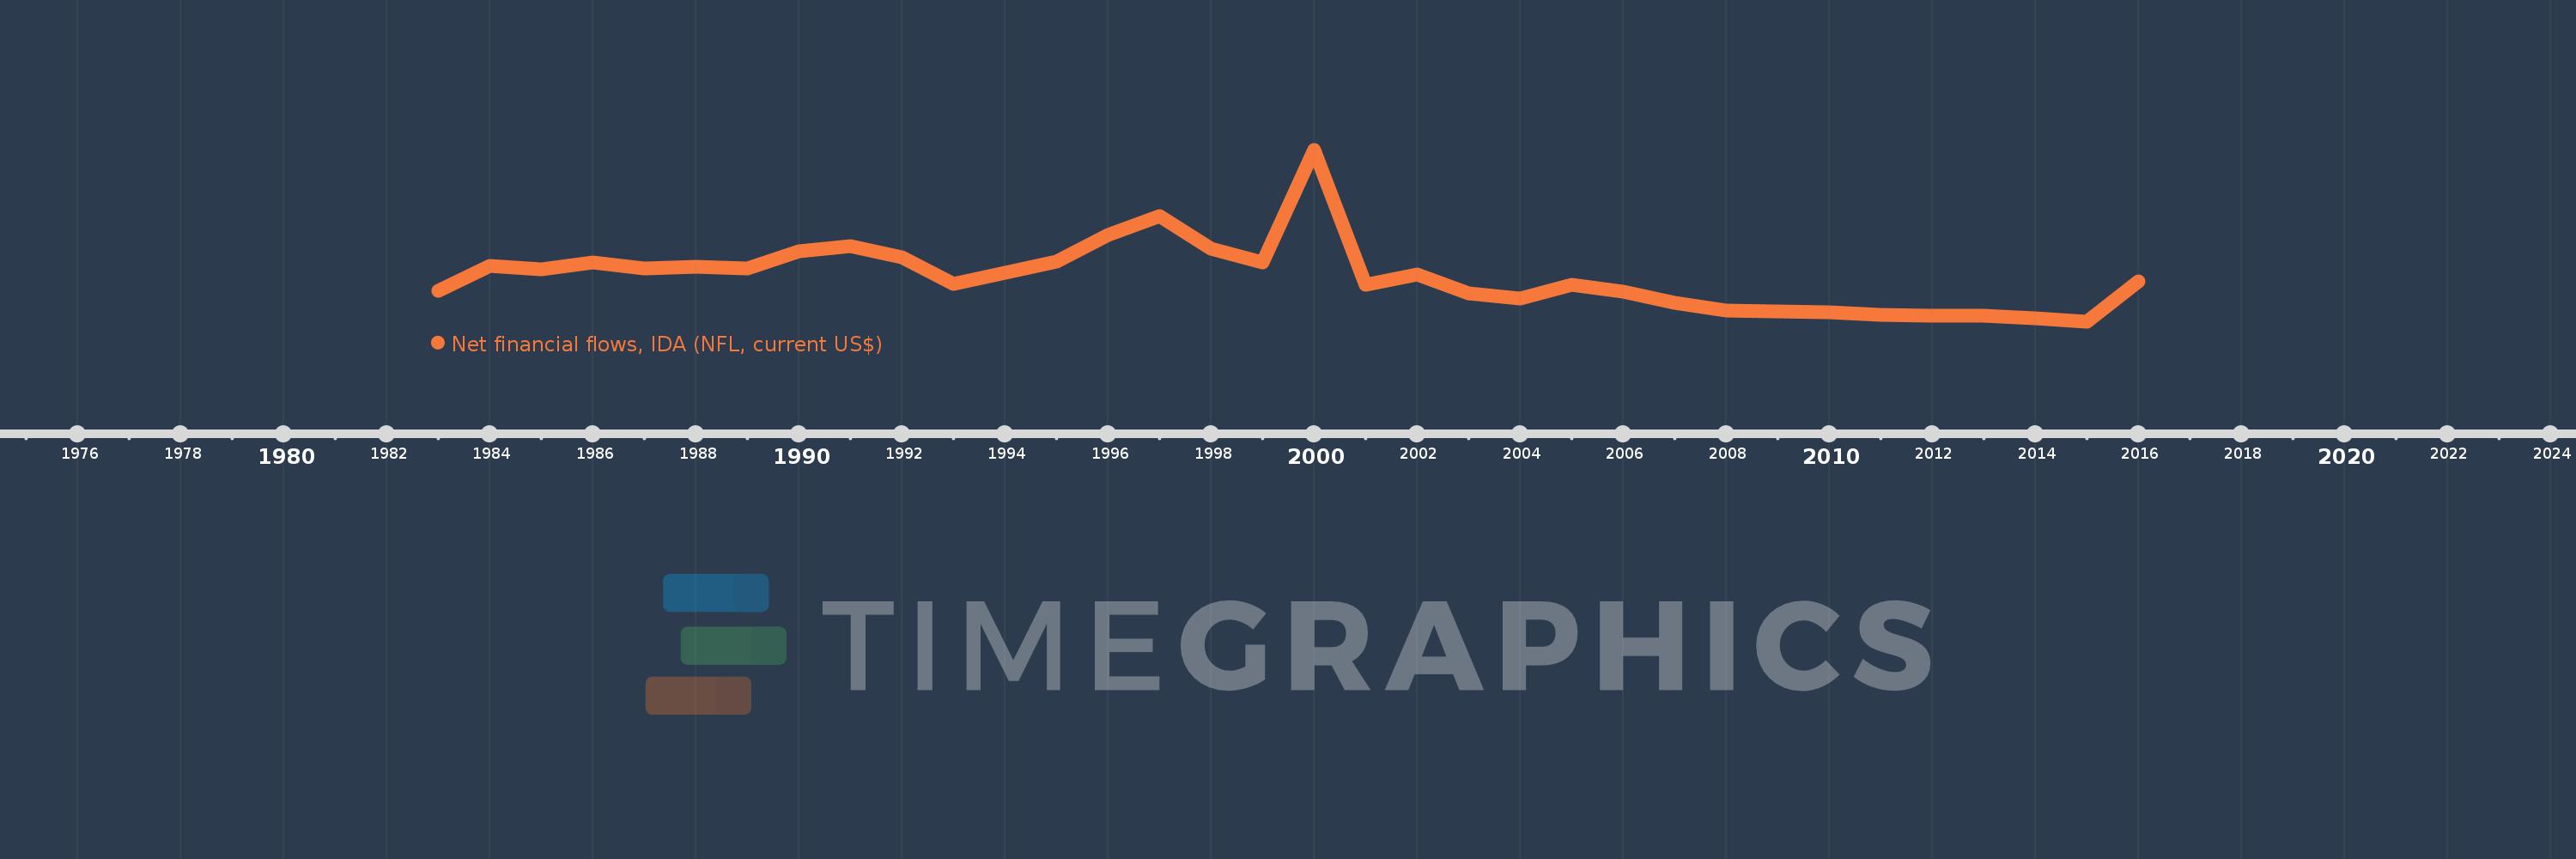
Net financial flows, IDA (NFL, current US$)
2016,2015,2014,2013,2012,2011,2010,2009,2008,2007,2006,2005,2004,2003,2002,2001,2000,1999,1998,1997,1996,1995,1994,1993,1992,1991,1990,1989,1988,1987,1986,1985,1984,1983
This statistics in other country:
Timeline:
This timeline shows a graph from 1983 to 2016 of Solomon Islands. No data until 1982. Number of actual observations by date: 34.
Source name:
World Development Indicators
Source organization:
World Bank, International Debt Statistics.
Categories, topics:
External Debt
Last updated:
apr 23, 2017
Indicators value changes by year
Minimum:
-1.587 mln
jan 1, 2015
Maximum:
7.757 mln
jan 1, 2000
At the date of observation
Value
Absolute change
Change from previous value
jan 1, 1983
102.0K
+102.0K
0.0%
jan 1, 1984
1.463 mln
+1.361 mln
1.33K%
jan 1, 1985
1.274 mln
-189.0K
-12.92%
jan 1, 1986
1.641 mln
+367.0K
28.81%
jan 1, 1987
1.314 mln
-327.0K
-19.93%
jan 1, 1988
1.412 mln
+98.0K
7.46%
jan 1, 1989
1.303 mln
-109.0K
-7.72%
jan 1, 1990
2.281 mln
+978.0K
75.06%
jan 1, 1991
2.544 mln
+263.0K
11.53%
jan 1, 1992
1.92 mln
-624.0K
-24.53%
jan 1, 1993
498.0K
-1.422 mln
-74.06%
jan 1, 1994
1.111 mln
+613.0K
123.09%
jan 1, 1995
1.715 mln
+604.0K
54.37%
jan 1, 1996
3.135 mln
+1.42 mln
82.8%
jan 1, 1997
4.163 mln
+1.028 mln
32.79%
jan 1, 1998
2.398 mln
-1.765 mln
-42.4%
jan 1, 1999
1.666 mln
-732.0K
-30.53%
jan 1, 2000
7.757 mln
+6.091 mln
365.61%
jan 1, 2001
431.0K
-7.326 mln
-94.44%
jan 1, 2002
1.006 mln
+575.0K
133.41%
jan 1, 2003
-53.0K
-1.059 mln
-105.27%
jan 1, 2004
-332.0K
-279.0K
526.42%
jan 1, 2005
417.0K
+749.0K
-225.6%
jan 1, 2006
55.0K
-362.0K
-86.81%
jan 1, 2007
-530.0K
-585.0K
-1.06K%
jan 1, 2008
-983.0K
-453.0K
85.47%
jan 1, 2009
-1.023 mln
-40.0K
4.07%
jan 1, 2010
-1.08 mln
-57.0K
5.57%
jan 1, 2011
-1.178 mln
-98.0K
9.07%
jan 1, 2012
-1.26 mln
-82.0K
6.96%
jan 1, 2013
-1.223 mln
+37.0K
-2.94%
jan 1, 2014
-1.399 mln
-176.0K
14.39%
jan 1, 2015
-1.587 mln
-188.0K
13.44%
jan 1, 2016
623.0K
+2.21 mln
-139.26%
Ranking of countries by current statistics by years


Comments: