29
/
en
AIzaSyAYiBZKx7MnpbEhh9jyipgxe19OcubqV5w
April 1, 2024
50285
Middle East & North Africa (IDA & IBRD countries)
TMN
false
2
1
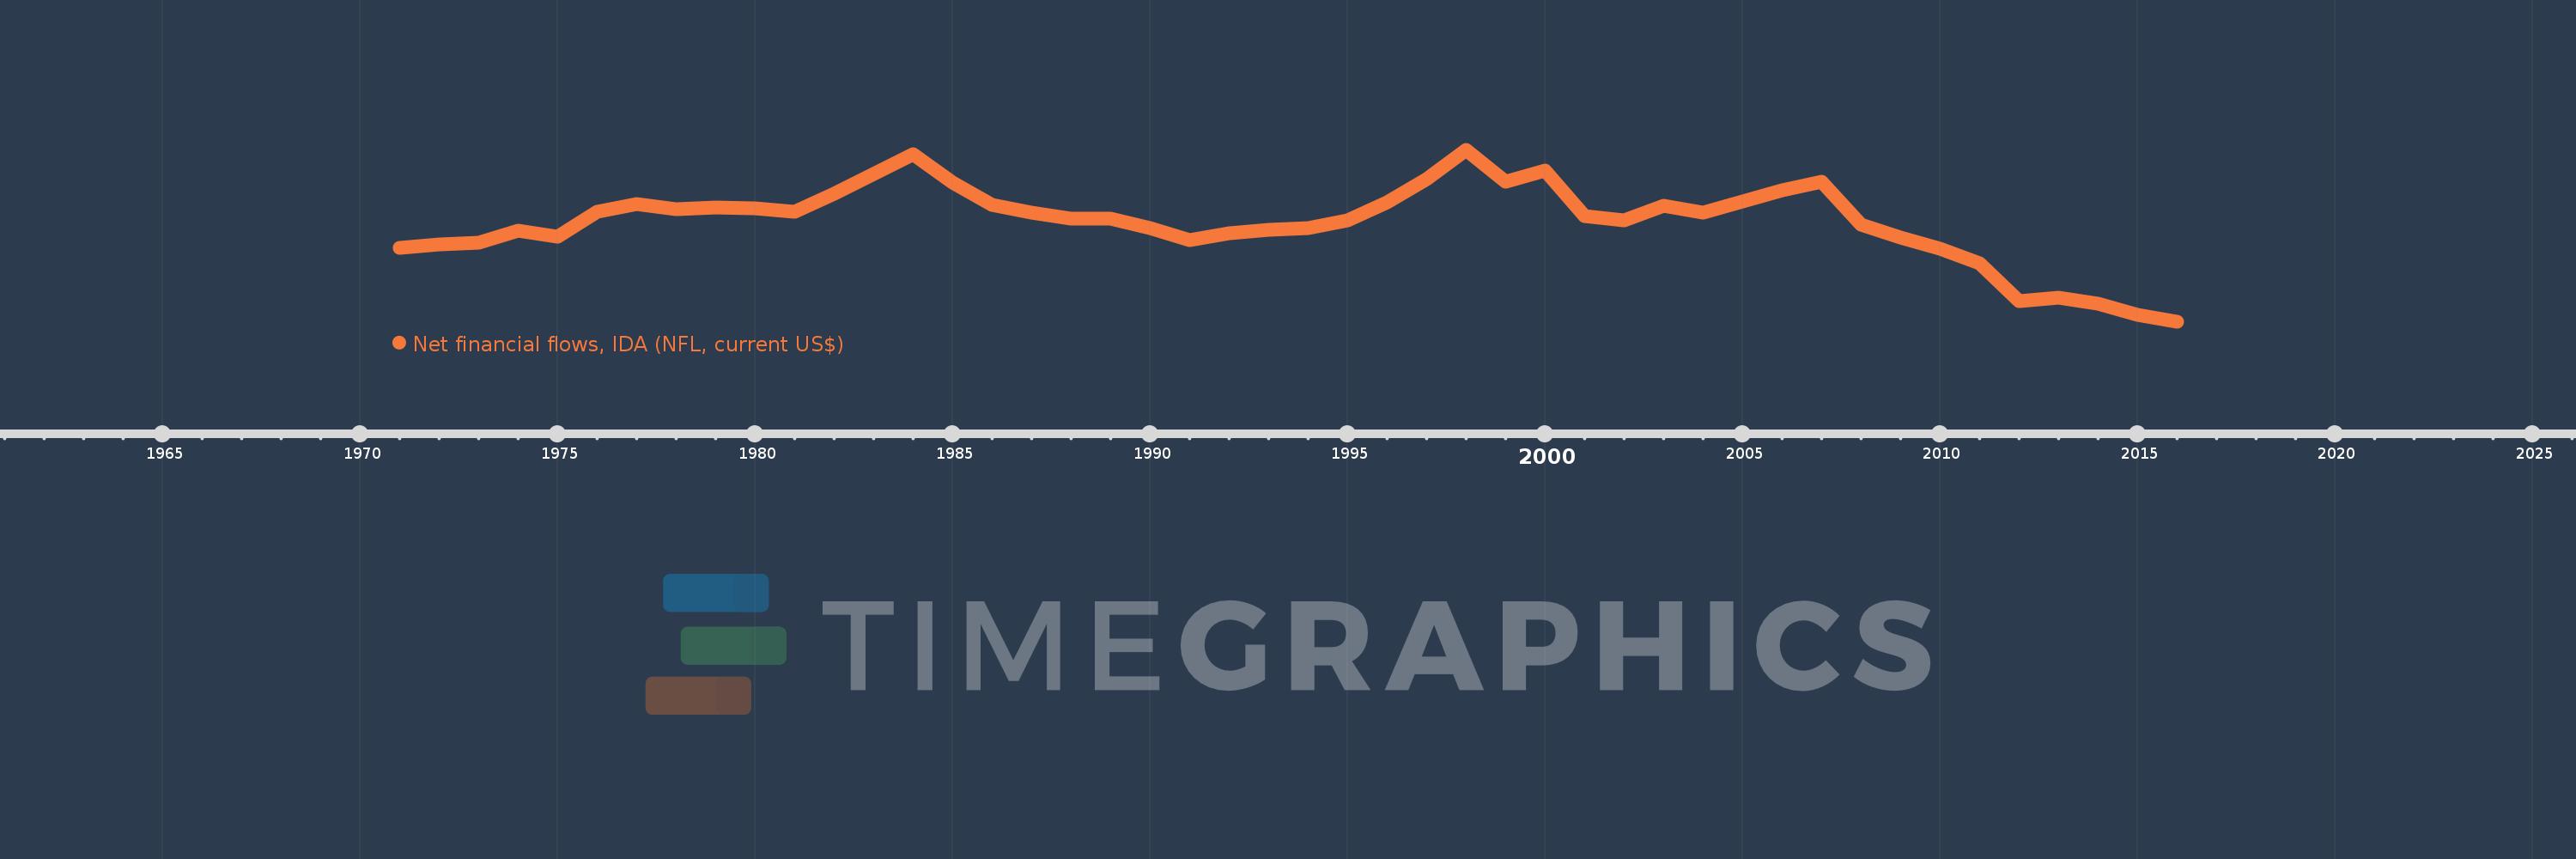
Net financial flows, IDA (NFL, current US$)
2016,2015,2014,2013,2012,2011,2010,2009,2008,2007,2006,2005,2004,2003,2002,2001,2000,1999,1998,1997,1996,1995,1994,1993,1992,1991,1990,1989,1988,1987,1986,1985,1984,1983,1982,1981,1980,1979,1978,1977,1976,1975,1974,1973,1972,1971
This statistics in other country:
Timeline:
This timeline shows a graph from 1971 to 2016 of Middle East & North Africa (IDA & IBRD countries). No data until 1970. Number of actual observations by date: 46.
Source name:
World Development Indicators
Source organization:
World Bank, International Debt Statistics.
Categories, topics:
External Debt
Last updated:
apr 23, 2017
Indicators value changes by year
Minimum:
-145.027 mln
jan 1, 2016
Maximum:
208.275 mln
jan 1, 1998
At the date of observation
Value
Absolute change
Change from previous value
jan 1, 1971
7.793 mln
+7.793 mln
0.0%
jan 1, 1972
13.821 mln
+6.028 mln
77.35%
jan 1, 1973
18.469 mln
+4.648 mln
33.63%
jan 1, 1974
43.135 mln
+24.666 mln
133.55%
jan 1, 1975
31.164 mln
-11.971 mln
-27.75%
jan 1, 1976
81.547 mln
+50.383 mln
161.67%
jan 1, 1977
97.374 mln
+15.827 mln
19.41%
jan 1, 1978
86.7 mln
-10.674 mln
-10.96%
jan 1, 1979
89.796 mln
+3.096 mln
3.57%
jan 1, 1980
88.613 mln
-1.183 mln
-1.32%
jan 1, 1981
80.865 mln
-7.748 mln
-8.74%
jan 1, 1982
118.447 mln
+37.582 mln
46.47%
jan 1, 1983
158.54 mln
+40.093 mln
33.85%
jan 1, 1984
199.352 mln
+40.812 mln
25.74%
jan 1, 1985
141.939 mln
-57.413 mln
-28.8%
jan 1, 1986
96.622 mln
-45.317 mln
-31.93%
jan 1, 1987
79.542 mln
-17.08 mln
-17.68%
jan 1, 1988
67.637 mln
-11.905 mln
-14.97%
jan 1, 1989
66.998 mln
-639.0K
-0.94%
jan 1, 1990
48.397 mln
-18.601 mln
-27.76%
jan 1, 1991
23.504 mln
-24.893 mln
-51.44%
jan 1, 1992
37.024 mln
+13.52 mln
57.52%
jan 1, 1993
44.779 mln
+7.755 mln
20.95%
jan 1, 1994
47.307 mln
+2.528 mln
5.65%
jan 1, 1995
63.208 mln
+15.901 mln
33.61%
jan 1, 1996
100.178 mln
+36.97 mln
58.49%
jan 1, 1997
149.384 mln
+49.206 mln
49.12%
jan 1, 1998
208.275 mln
+58.891 mln
39.42%
jan 1, 1999
144.241 mln
-64.034 mln
-30.74%
jan 1, 2000
167.288 mln
+23.047 mln
15.98%
jan 1, 2001
73.468 mln
-93.82 mln
-56.08%
jan 1, 2002
63.07 mln
-10.398 mln
-14.15%
jan 1, 2003
94.108 mln
+31.038 mln
49.21%
jan 1, 2004
79.554 mln
-14.554 mln
-15.47%
jan 1, 2005
103.524 mln
+23.97 mln
30.13%
jan 1, 2006
125.843 mln
+22.319 mln
21.56%
jan 1, 2007
143.186 mln
+17.343 mln
13.78%
jan 1, 2008
55.095 mln
-88.091 mln
-61.52%
jan 1, 2009
28.88 mln
-26.215 mln
-47.58%
jan 1, 2010
6.397 mln
-22.483 mln
-77.85%
jan 1, 2011
-24.047 mln
-30.444 mln
-475.91%
jan 1, 2012
-102.116 mln
-78.069 mln
324.65%
jan 1, 2013
-95.001 mln
+7.115 mln
-6.97%
jan 1, 2014
-106.935 mln
-11.934 mln
12.56%
jan 1, 2015
-131.056 mln
-24.121 mln
22.56%
jan 1, 2016
-145.027 mln
-13.971 mln
10.66%
Ranking of countries by current statistics by years


Comments: