29
/
en
AIzaSyAYiBZKx7MnpbEhh9jyipgxe19OcubqV5w
April 1, 2024
239644
Sierra Leone
SLE
true
2
1
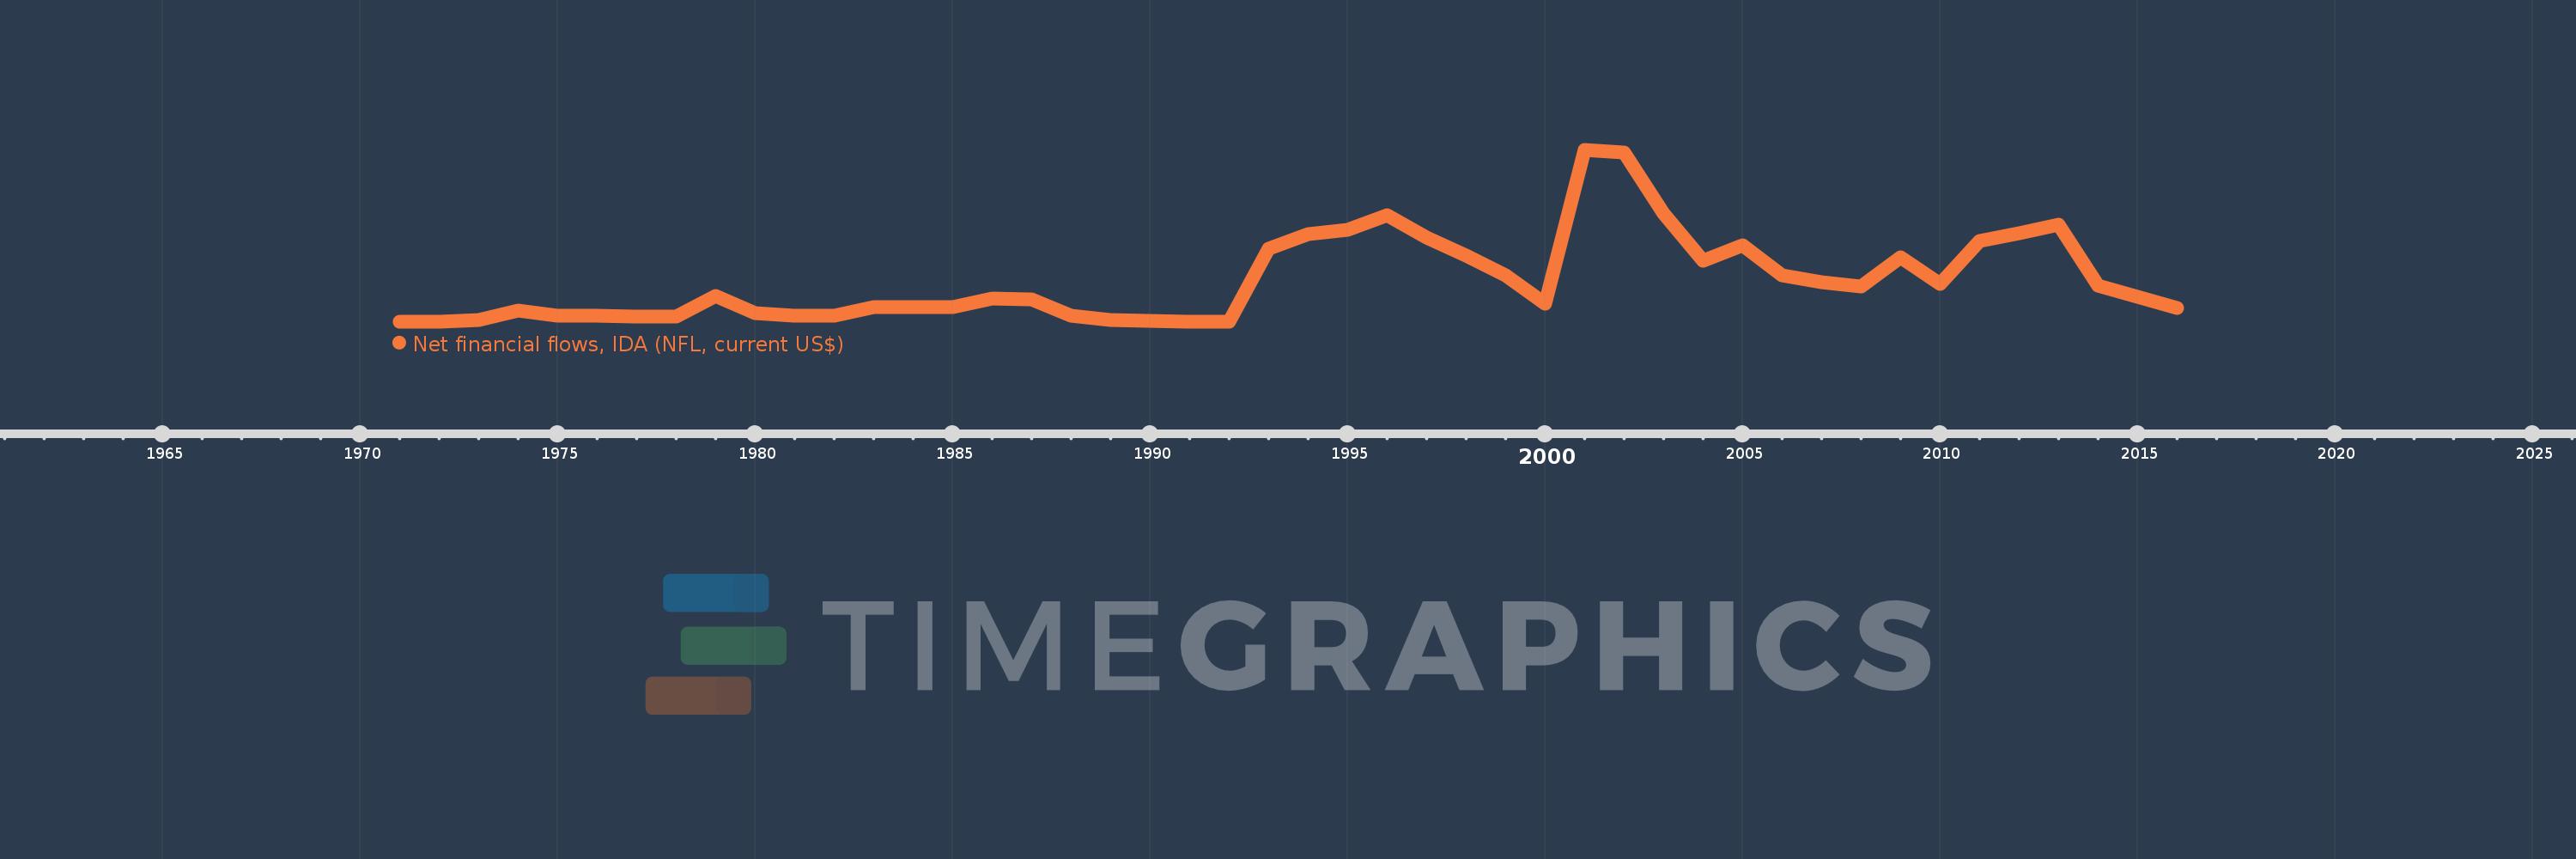
Net financial flows, IDA (NFL, current US$)
2016,2015,2014,2013,2012,2011,2010,2009,2008,2007,2006,2005,2004,2003,2002,2001,2000,1999,1998,1997,1996,1995,1994,1993,1992,1991,1990,1989,1988,1987,1986,1985,1984,1983,1982,1981,1980,1979,1978,1977,1976,1975,1974,1973,1972,1971
This statistics in other country:
Timeline:
This timeline shows a graph from 1971 to 2016 of Sierra Leone. No data until 1970. Number of actual observations by date: 46.
Source name:
World Development Indicators
Source organization:
World Bank, International Debt Statistics.
Categories, topics:
External Debt
Last updated:
apr 23, 2017
Indicators value changes by year
Minimum:
-128.0K
jan 1, 1992
Maximum:
68.301 mln
jan 1, 2001
At the date of observation
Value
Absolute change
Change from previous value
jan 1, 1971
7.0K
+7.0K
0.0%
jan 1, 1972
69.0K
+62.0K
885.71%
jan 1, 1973
782.0K
+713.0K
1.03K%
jan 1, 1974
4.306 mln
+3.524 mln
450.64%
jan 1, 1975
2.205 mln
-2.101 mln
-48.79%
jan 1, 1976
2.395 mln
+190.0K
8.62%
jan 1, 1977
1.937 mln
-458.0K
-19.12%
jan 1, 1978
2.04 mln
+103.0K
5.32%
jan 1, 1979
10.222 mln
+8.182 mln
401.08%
jan 1, 1980
3.349 mln
-6.873 mln
-67.24%
jan 1, 1981
2.339 mln
-1.01 mln
-30.16%
jan 1, 1982
2.342 mln
+3.0K
0.13%
jan 1, 1983
5.676 mln
+3.334 mln
142.36%
jan 1, 1984
5.739 mln
+63.0K
1.11%
jan 1, 1985
5.823 mln
+84.0K
1.46%
jan 1, 1986
9.178 mln
+3.355 mln
57.62%
jan 1, 1987
8.891 mln
-287.0K
-3.13%
jan 1, 1988
2.237 mln
-6.654 mln
-74.84%
jan 1, 1989
829.0K
-1.408 mln
-62.94%
jan 1, 1990
255.0K
-574.0K
-69.24%
jan 1, 1991
12.0K
-243.0K
-95.29%
jan 1, 1992
-128.0K
-140.0K
-1.17K%
jan 1, 1993
29.11 mln
+29.238 mln
-22.84K%
jan 1, 1994
34.739 mln
+5.629 mln
19.34%
jan 1, 1995
36.635 mln
+1.896 mln
5.46%
jan 1, 1996
42.371 mln
+5.736 mln
15.66%
jan 1, 1997
33.609 mln
-8.762 mln
-20.68%
jan 1, 1998
26.39 mln
-7.219 mln
-21.48%
jan 1, 1999
18.598 mln
-7.792 mln
-29.53%
jan 1, 2000
7.084 mln
-11.514 mln
-61.91%
jan 1, 2001
68.301 mln
+61.217 mln
864.16%
jan 1, 2002
67.236 mln
-1.065 mln
-1.56%
jan 1, 2003
42.998 mln
-24.238 mln
-36.05%
jan 1, 2004
24.318 mln
-18.68 mln
-43.44%
jan 1, 2005
30.56 mln
+6.242 mln
25.67%
jan 1, 2006
18.552 mln
-12.008 mln
-39.29%
jan 1, 2007
15.84 mln
-2.712 mln
-14.62%
jan 1, 2008
14.17 mln
-1.67 mln
-10.54%
jan 1, 2009
25.642 mln
+11.472 mln
80.96%
jan 1, 2010
15.085 mln
-10.557 mln
-41.17%
jan 1, 2011
32.059 mln
+16.974 mln
112.52%
jan 1, 2012
35.185 mln
+3.126 mln
9.75%
jan 1, 2013
38.596 mln
+3.411 mln
9.69%
jan 1, 2014
14.347 mln
-24.249 mln
-62.83%
jan 1, 2015
9.781 mln
-4.566 mln
-31.83%
jan 1, 2016
5.465 mln
-4.316 mln
-44.13%
Ranking of countries by current statistics by years


Comments: