29
/
en
AIzaSyAYiBZKx7MnpbEhh9jyipgxe19OcubqV5w
April 1, 2024
279057
Uzbekistan
UZB
true
2
1
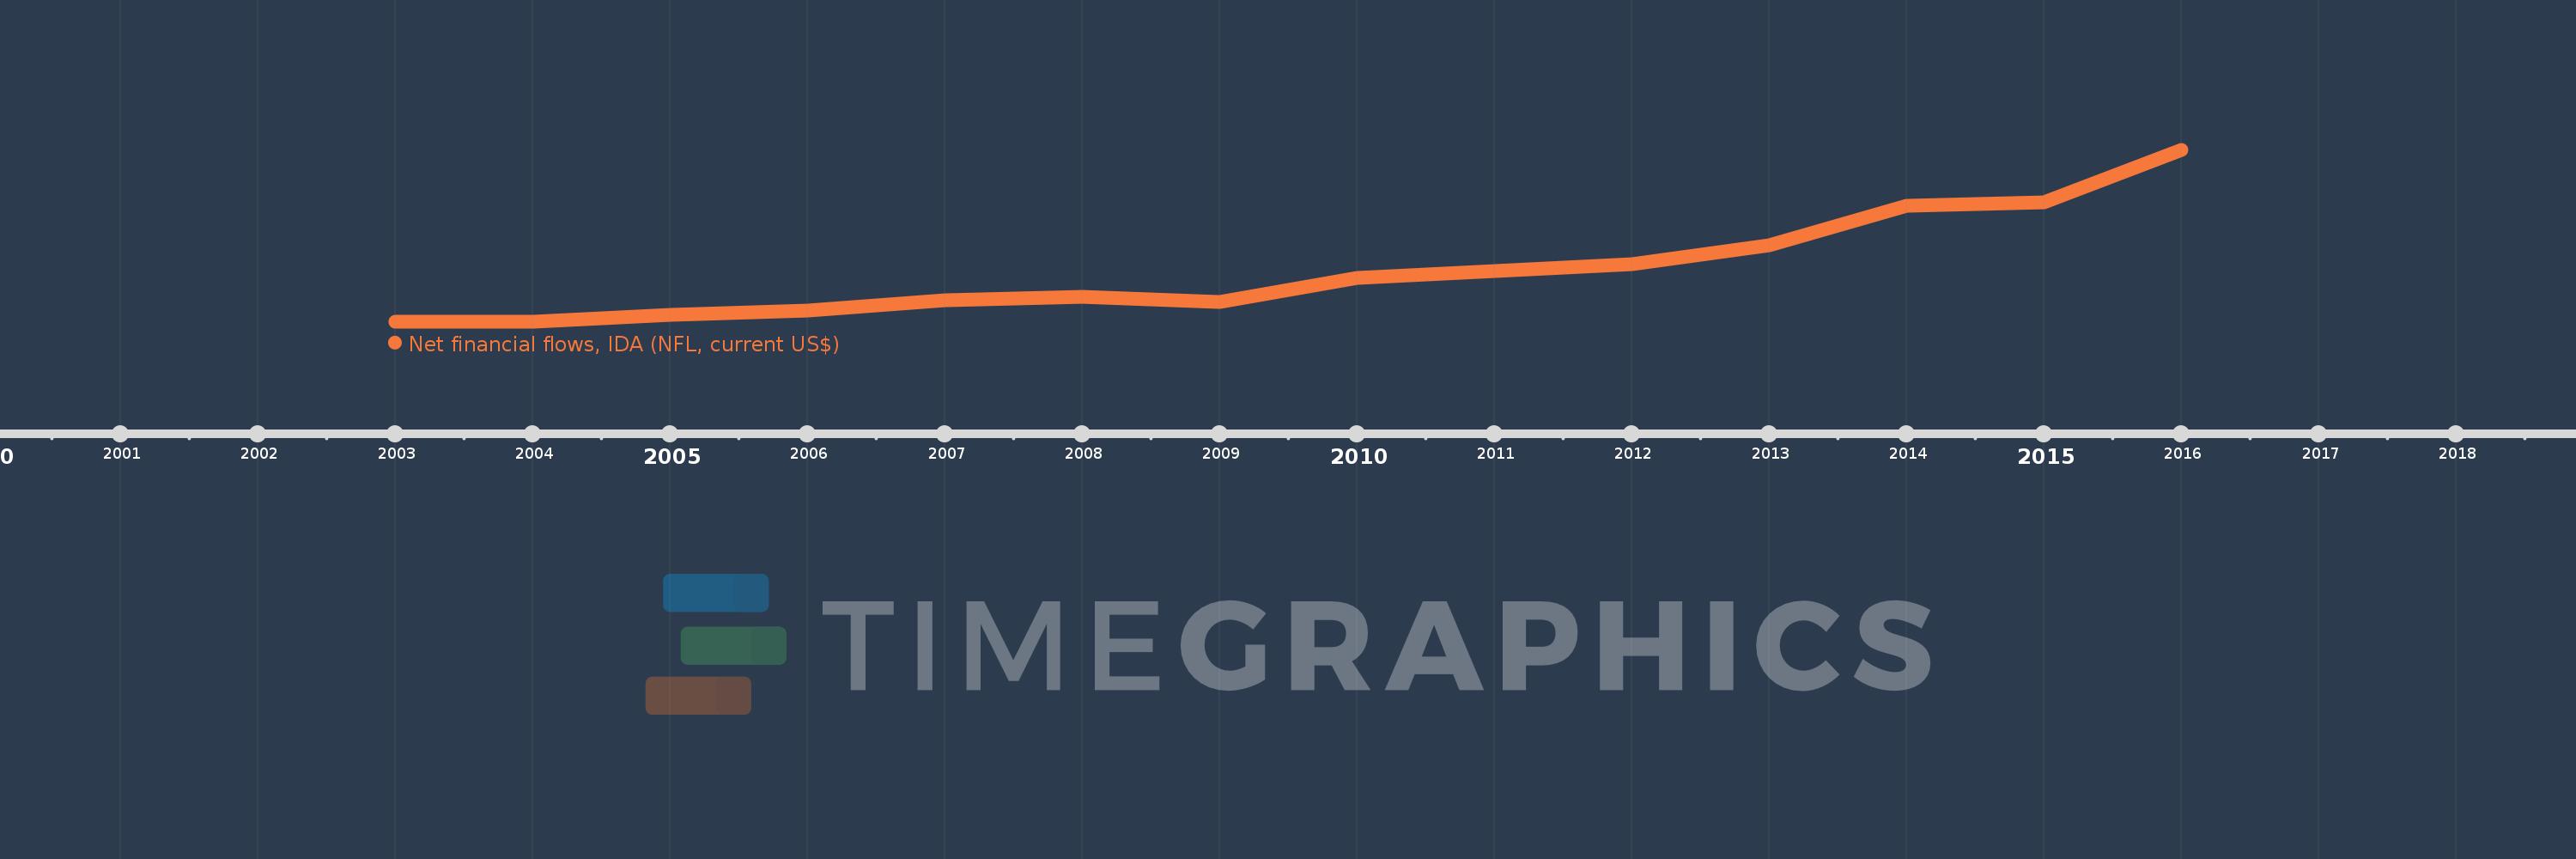
Net financial flows, IDA (NFL, current US$)
2016,2015,2014,2013,2012,2011,2010,2009,2008,2007,2006,2005,2004,2003
This statistics in other country:
Timeline:
This timeline shows a graph from 2003 to 2016 of Uzbekistan. No data until 2002. Number of actual observations by date: 14.
Source name:
World Development Indicators
Source organization:
World Bank, International Debt Statistics.
Categories, topics:
External Debt
Last updated:
apr 23, 2017
Indicators value changes by year
Maximum:
107.966 mln
jan 1, 2016
At the date of observation
Value
Absolute change
Change from previous value
jan 1, 2004
210.0K
+210.0K
%
jan 1, 2005
4.505 mln
+4.295 mln
2.05K%
jan 1, 2006
7.085 mln
+2.58 mln
57.27%
jan 1, 2007
13.388 mln
+6.303 mln
88.96%
jan 1, 2008
15.774 mln
+2.386 mln
17.82%
jan 1, 2009
12.673 mln
-3.101 mln
-19.66%
jan 1, 2010
27.603 mln
+14.93 mln
117.81%
jan 1, 2011
32.097 mln
+4.494 mln
16.28%
jan 1, 2012
36.316 mln
+4.219 mln
13.14%
jan 1, 2013
48.247 mln
+11.931 mln
32.85%
jan 1, 2014
72.991 mln
+24.744 mln
51.29%
jan 1, 2015
74.949 mln
+1.958 mln
2.68%
jan 1, 2016
107.966 mln
+33.017 mln
44.05%
Ranking of countries by current statistics by years


Comments: