29
/
en
AIzaSyAYiBZKx7MnpbEhh9jyipgxe19OcubqV5w
April 1, 2024
250133
St. Kitts and Nevis
KNA
true
2
1
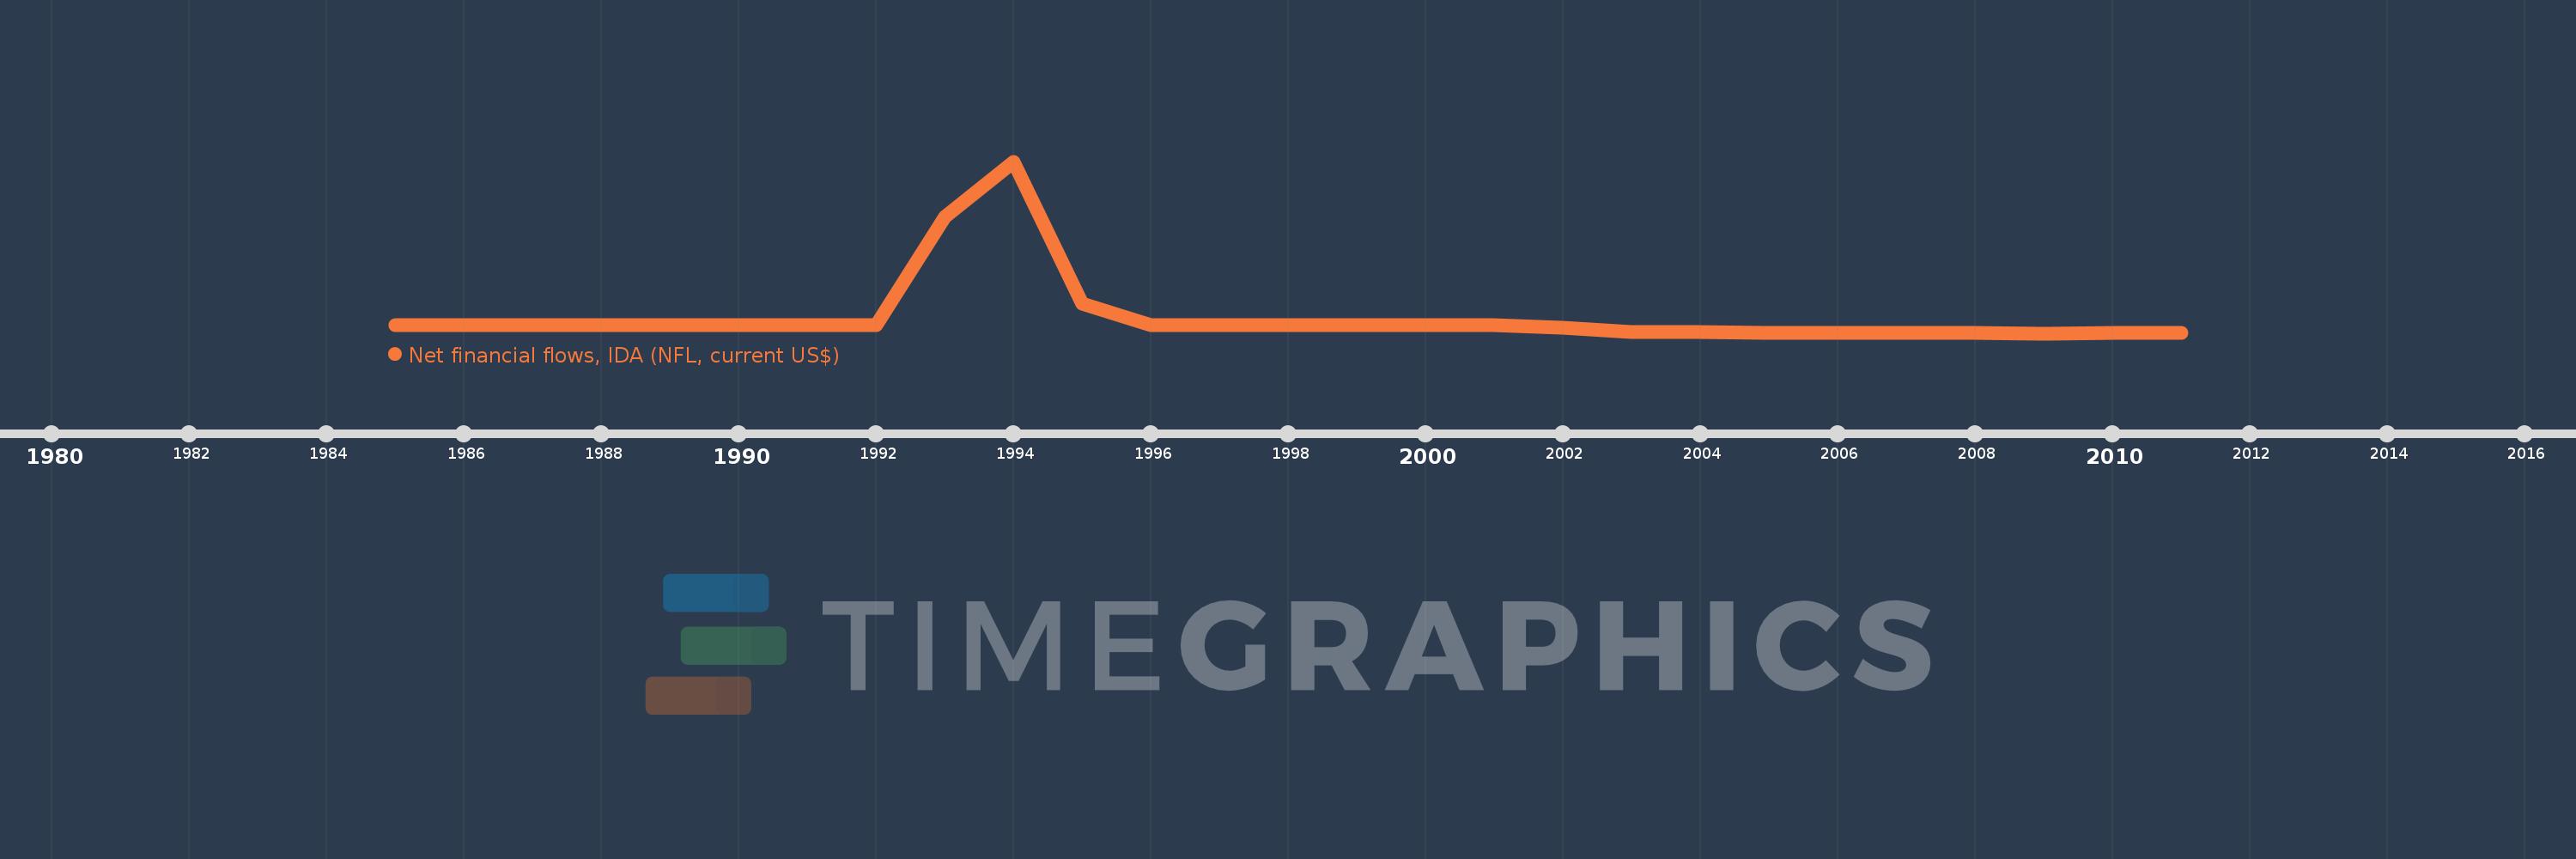
Net financial flows, IDA (NFL, current US$)
2011,2010,2009,2008,2007,2006,2005,2004,2003,2002,2001,2000,1999,1998,1997,1996,1995,1994,1993,1992,1991,1990,1989,1988,1987,1986,1985
This statistics in other country:
Timeline:
This timeline shows a graph from 1985 to 2011 of St. Kitts and Nevis. No data until 1984. Number of actual observations by date: 27.
Source name:
World Development Indicators
Source organization:
World Bank, International Debt Statistics.
Categories, topics:
External Debt
Last updated:
apr 23, 2017
Indicators value changes by year
Minimum:
-44.0K
jan 1, 2009
Maximum:
852.0K
jan 1, 1994
At the date of observation
Value
Absolute change
Change from previous value
jan 1, 1993
561.0K
+561.0K
%
jan 1, 1994
852.0K
+291.0K
51.87%
jan 1, 1995
111.0K
-741.0K
-86.97%
jan 1, 1996
0.0
-111.0K
-100.0%
jan 1, 2002
-17.0K
-17.0K
%
jan 1, 2003
-36.0K
-19.0K
111.76%
jan 1, 2004
-38.0K
-2.0K
5.56%
jan 1, 2005
-41.0K
-3.0K
7.89%
jan 1, 2006
-41.0K
0.0
0.0%
jan 1, 2007
-40.0K
+1000.0
-2.44%
jan 1, 2008
-42.0K
-2.0K
5.0%
jan 1, 2009
-44.0K
-2.0K
4.76%
jan 1, 2010
-42.0K
+2.0K
-4.55%
jan 1, 2011
-42.0K
0.0
0.0%
Ranking of countries by current statistics by years


Comments: