29
/
en
AIzaSyAYiBZKx7MnpbEhh9jyipgxe19OcubqV5w
April 1, 2024
96472
Burundi
BDI
true
2
1
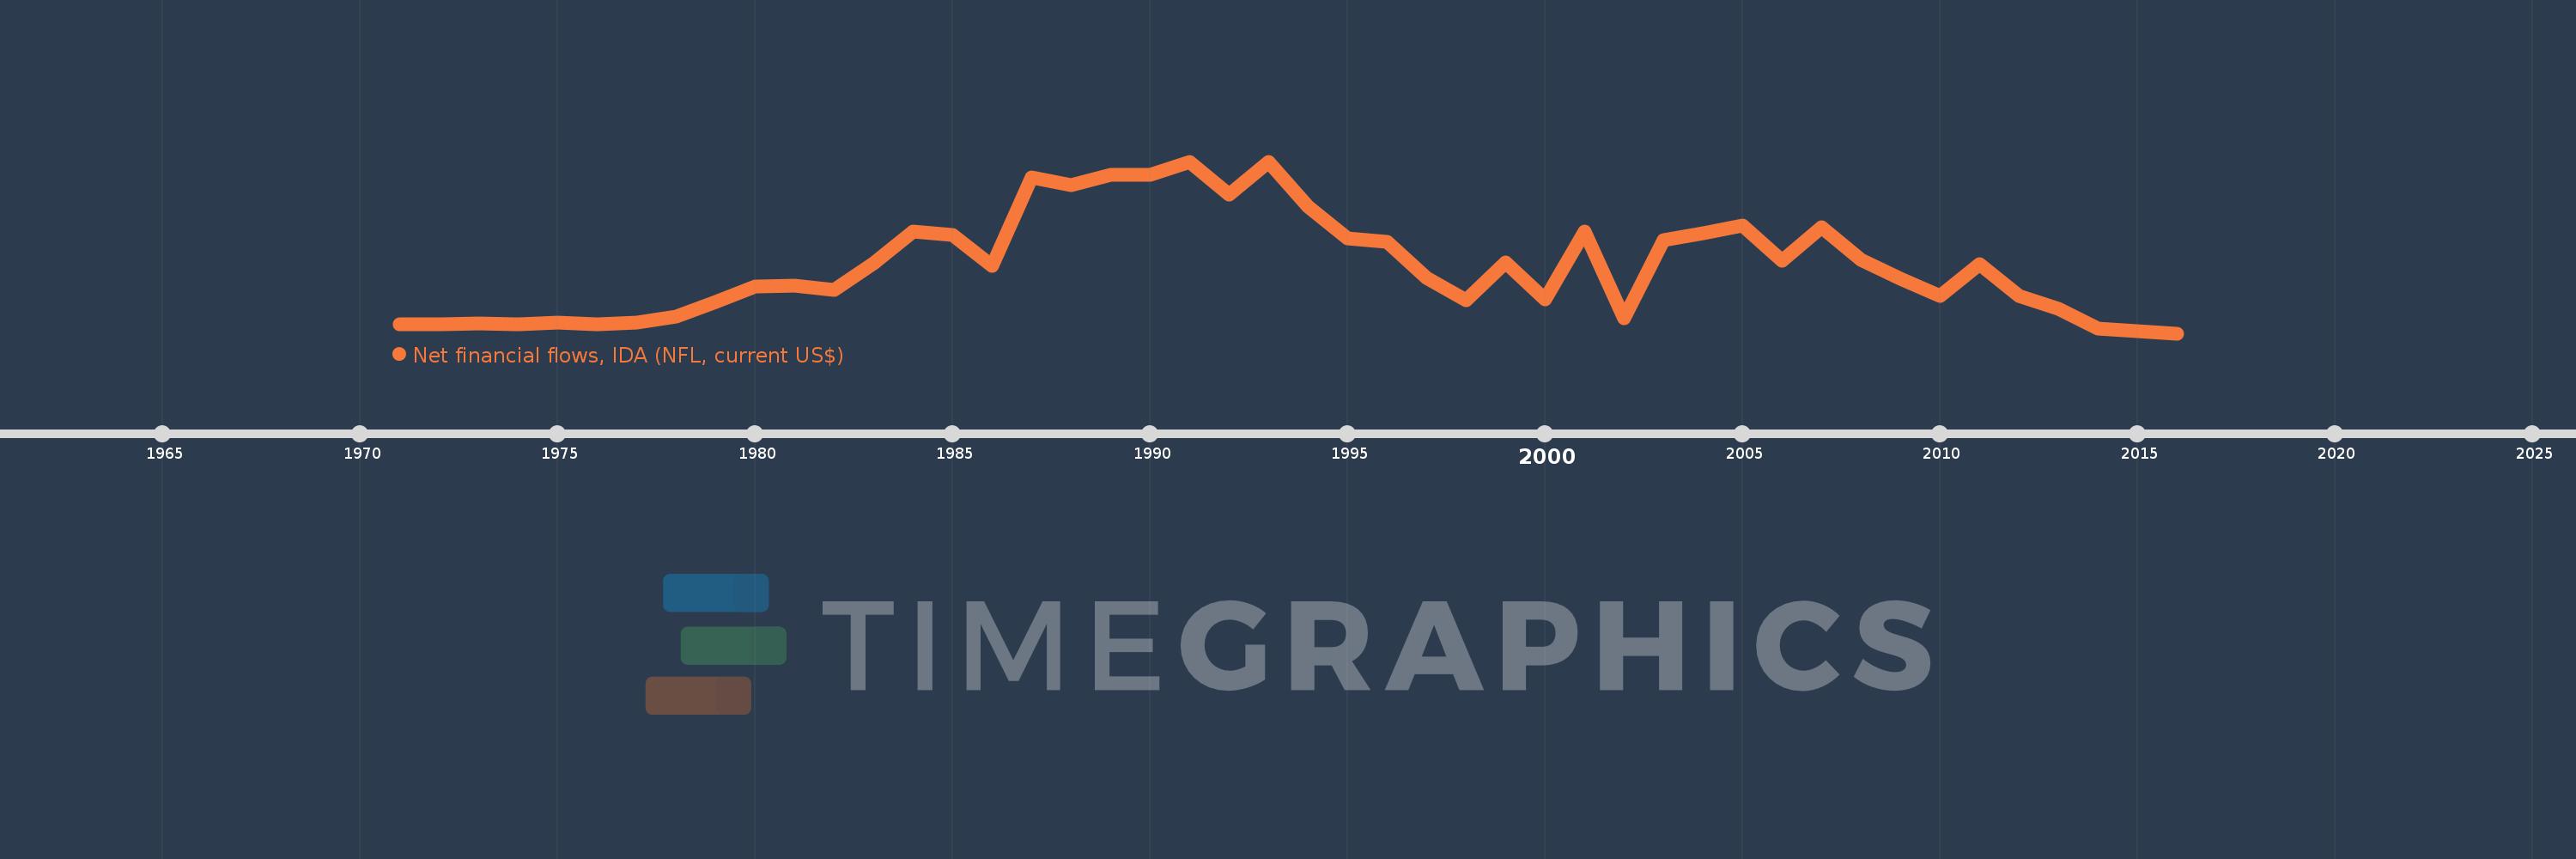
Net financial flows, IDA (NFL, current US$)
2016,2015,2014,2013,2012,2011,2010,2009,2008,2007,2006,2005,2004,2003,2002,2001,2000,1999,1998,1997,1996,1995,1994,1993,1992,1991,1990,1989,1988,1987,1986,1985,1984,1983,1982,1981,1980,1979,1978,1977,1976,1975,1974,1973,1972,1971
This statistics in other country:
Timeline:
This timeline shows a graph from 1971 to 2016 of Burundi. No data until 1970. Number of actual observations by date: 46.
Source name:
World Development Indicators
Source organization:
World Bank, International Debt Statistics.
Categories, topics:
External Debt
Last updated:
apr 23, 2017
Indicators value changes by year
Minimum:
-2.228 mln
jan 1, 2016
Maximum:
47.879 mln
jan 1, 1991
At the date of observation
Value
Absolute change
Change from previous value
jan 1, 1971
358.0K
+358.0K
0.0%
jan 1, 1972
505.0K
+147.0K
41.06%
jan 1, 1973
569.0K
+64.0K
12.67%
jan 1, 1974
314.0K
-255.0K
-44.82%
jan 1, 1975
881.0K
+567.0K
180.57%
jan 1, 1976
279.0K
-602.0K
-68.33%
jan 1, 1977
990.0K
+711.0K
254.84%
jan 1, 1978
2.552 mln
+1.562 mln
157.78%
jan 1, 1979
6.919 mln
+4.367 mln
171.12%
jan 1, 1980
11.341 mln
+4.422 mln
63.91%
jan 1, 1981
11.609 mln
+268.0K
2.36%
jan 1, 1982
10.346 mln
-1.263 mln
-10.88%
jan 1, 1983
18.11 mln
+7.764 mln
75.04%
jan 1, 1984
27.361 mln
+9.251 mln
51.08%
jan 1, 1985
26.568 mln
-793.0K
-2.9%
jan 1, 1986
17.323 mln
-9.245 mln
-34.8%
jan 1, 1987
43.231 mln
+25.908 mln
149.56%
jan 1, 1988
40.946 mln
-2.285 mln
-5.29%
jan 1, 1989
43.945 mln
+2.999 mln
7.32%
jan 1, 1990
44.044 mln
+99.0K
0.23%
jan 1, 1991
47.879 mln
+3.835 mln
8.71%
jan 1, 1992
38.261 mln
-9.618 mln
-20.09%
jan 1, 1993
47.65 mln
+9.389 mln
24.54%
jan 1, 1994
34.617 mln
-13.033 mln
-27.35%
jan 1, 1995
25.535 mln
-9.082 mln
-26.24%
jan 1, 1996
24.439 mln
-1.096 mln
-4.29%
jan 1, 1997
13.92 mln
-10.519 mln
-43.04%
jan 1, 1998
7.373 mln
-6.547 mln
-47.03%
jan 1, 1999
18.479 mln
+11.106 mln
150.63%
jan 1, 2000
7.613 mln
-10.866 mln
-58.8%
jan 1, 2001
27.571 mln
+19.958 mln
262.16%
jan 1, 2002
2.192 mln
-25.379 mln
-92.05%
jan 1, 2003
25.027 mln
+22.835 mln
1.04K%
jan 1, 2004
26.921 mln
+1.894 mln
7.57%
jan 1, 2005
29.334 mln
+2.413 mln
8.96%
jan 1, 2006
18.857 mln
-10.477 mln
-35.72%
jan 1, 2007
28.824 mln
+9.967 mln
52.86%
jan 1, 2008
19.243 mln
-9.581 mln
-33.24%
jan 1, 2009
13.76 mln
-5.483 mln
-28.49%
jan 1, 2010
8.559 mln
-5.201 mln
-37.8%
jan 1, 2011
17.825 mln
+9.266 mln
108.26%
jan 1, 2012
8.584 mln
-9.241 mln
-51.84%
jan 1, 2013
5.01 mln
-3.574 mln
-41.64%
jan 1, 2014
-894.0K
-5.904 mln
-117.84%
jan 1, 2015
-1.636 mln
-742.0K
83.0%
jan 1, 2016
-2.228 mln
-592.0K
36.19%
Ranking of countries by current statistics by years


Comments: