29
/
en
AIzaSyAYiBZKx7MnpbEhh9jyipgxe19OcubqV5w
April 1, 2024
148282
Guyana
GUY
true
2
1
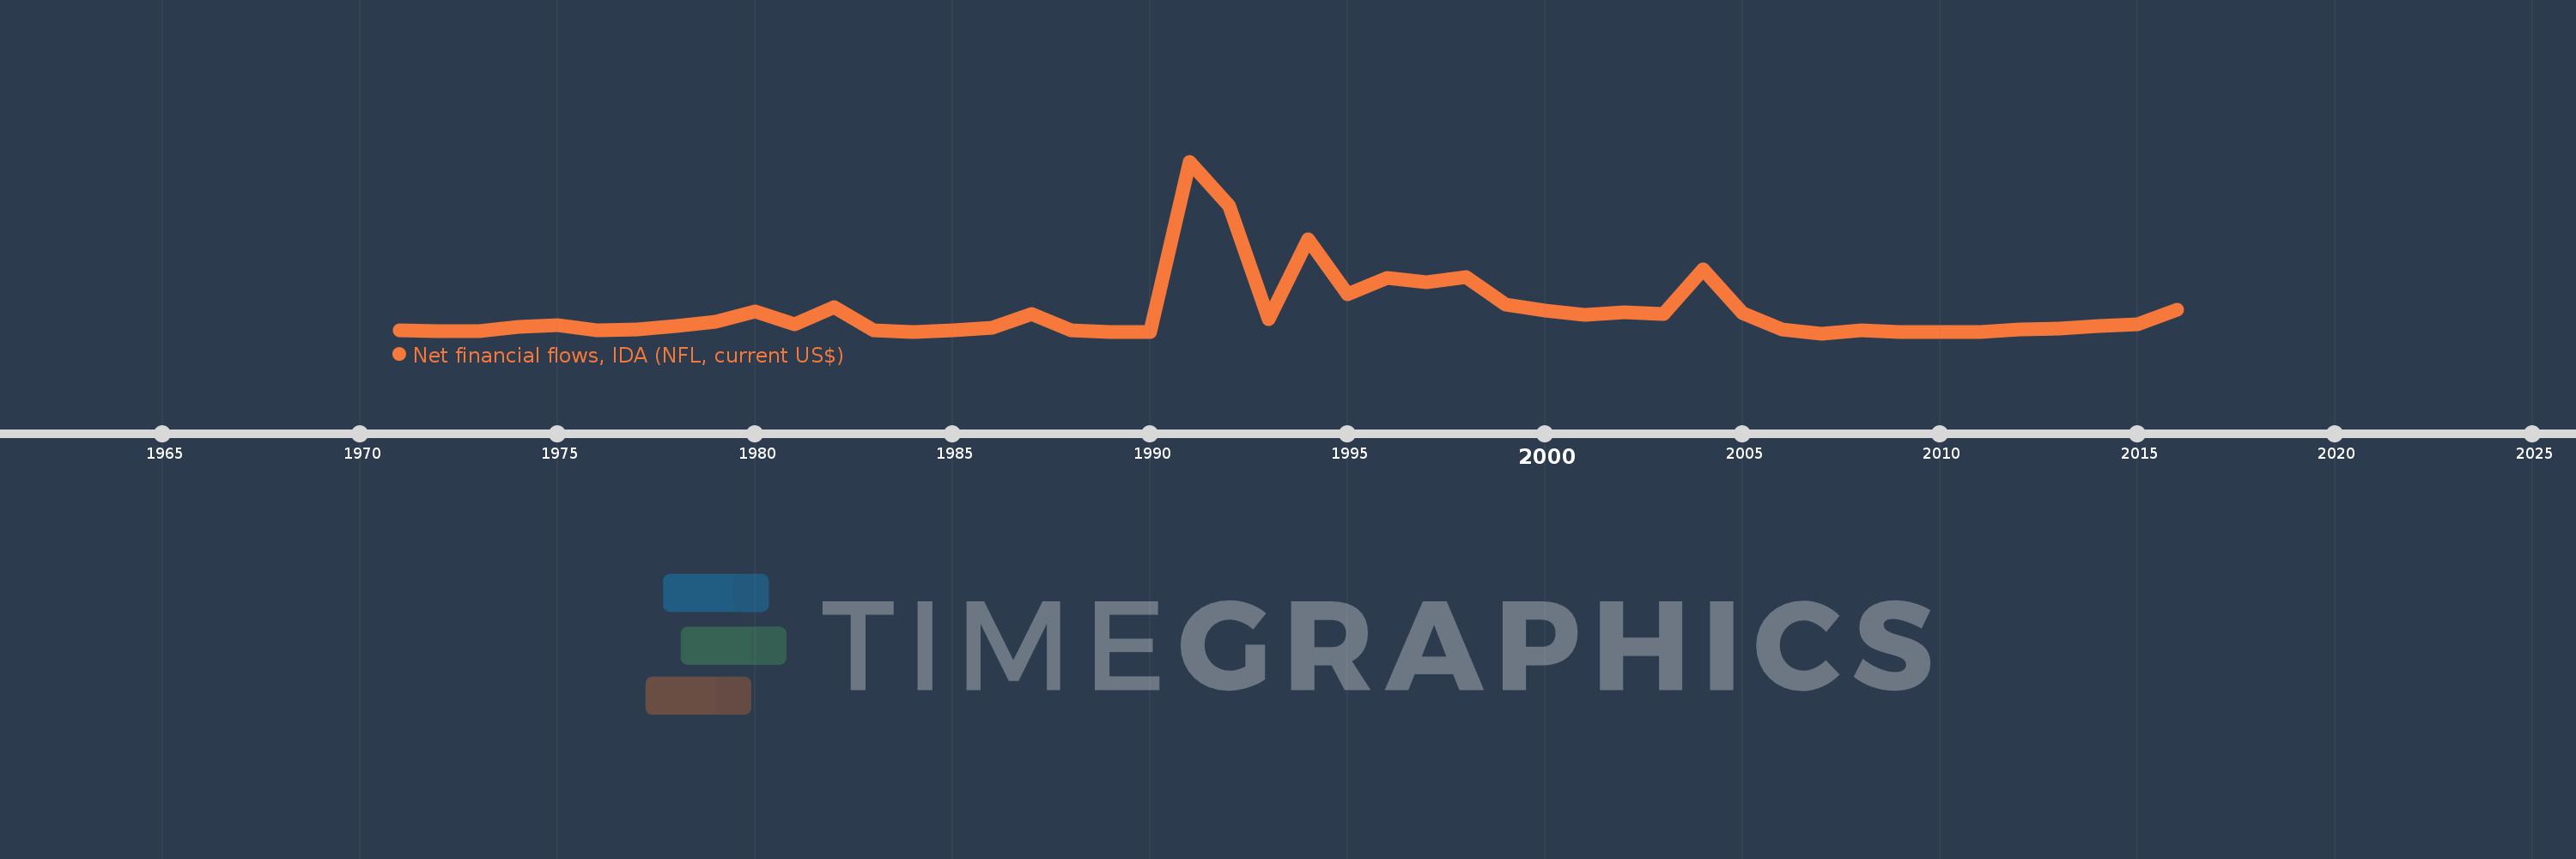
Net financial flows, IDA (NFL, current US$)
2016,2015,2014,2013,2012,2011,2010,2009,2008,2007,2006,2005,2004,2003,2002,2001,2000,1999,1998,1997,1996,1995,1994,1993,1992,1991,1990,1989,1988,1987,1986,1985,1984,1983,1982,1981,1980,1979,1978,1977,1976,1975,1974,1973,1972,1971
This statistics in other country:
Timeline:
This timeline shows a graph from 1971 to 2016 of Guyana. No data until 1970. Number of actual observations by date: 46.
Source name:
World Development Indicators
Source organization:
World Bank, International Debt Statistics.
Categories, topics:
External Debt
Last updated:
apr 23, 2017
Indicators value changes by year
Minimum:
-634.0K
jan 1, 2007
Maximum:
53.722 mln
jan 1, 1991
At the date of observation
Value
Absolute change
Change from previous value
jan 1, 1971
299.0K
+299.0K
0.0%
jan 1, 1972
176.0K
-123.0K
-41.14%
jan 1, 1973
172.0K
-4.0K
-2.27%
jan 1, 1974
1.343 mln
+1.171 mln
680.81%
jan 1, 1975
2.003 mln
+660.0K
49.14%
jan 1, 1976
372.0K
-1.631 mln
-81.43%
jan 1, 1977
537.0K
+165.0K
44.35%
jan 1, 1978
1.57 mln
+1.033 mln
192.36%
jan 1, 1979
2.933 mln
+1.363 mln
86.82%
jan 1, 1980
6.372 mln
+3.439 mln
117.25%
jan 1, 1981
2.137 mln
-4.235 mln
-66.46%
jan 1, 1982
7.787 mln
+5.65 mln
264.39%
jan 1, 1983
271.0K
-7.516 mln
-96.52%
jan 1, 1984
-96.0K
-367.0K
-135.42%
jan 1, 1985
217.0K
+313.0K
-326.04%
jan 1, 1986
1.117 mln
+900.0K
414.75%
jan 1, 1987
5.397 mln
+4.28 mln
383.17%
jan 1, 1988
442.0K
-4.955 mln
-91.81%
jan 1, 1989
-129.0K
-571.0K
-129.19%
jan 1, 1990
-274.0K
-145.0K
112.4%
jan 1, 1991
53.722 mln
+53.996 mln
-19.71K%
jan 1, 1992
39.614 mln
-14.108 mln
-26.26%
jan 1, 1993
3.866 mln
-35.748 mln
-90.24%
jan 1, 1994
29.164 mln
+25.298 mln
654.37%
jan 1, 1995
11.736 mln
-17.428 mln
-59.76%
jan 1, 1996
17.001 mln
+5.265 mln
44.86%
jan 1, 1997
15.522 mln
-1.479 mln
-8.7%
jan 1, 1998
17.11 mln
+1.588 mln
10.23%
jan 1, 1999
8.599 mln
-8.511 mln
-49.74%
jan 1, 2000
6.592 mln
-2.007 mln
-23.34%
jan 1, 2001
5.297 mln
-1.295 mln
-19.65%
jan 1, 2002
6.138 mln
+841.0K
15.88%
jan 1, 2003
5.554 mln
-584.0K
-9.51%
jan 1, 2004
19.582 mln
+14.028 mln
252.57%
jan 1, 2005
5.804 mln
-13.778 mln
-70.36%
jan 1, 2006
609.0K
-5.195 mln
-89.51%
jan 1, 2007
-634.0K
-1.243 mln
-204.11%
jan 1, 2008
406.0K
+1.04 mln
-164.04%
jan 1, 2009
-132.0K
-538.0K
-132.51%
jan 1, 2010
-130.0K
+2.0K
-1.52%
jan 1, 2011
-127.0K
+3.0K
-2.31%
jan 1, 2012
668.0K
+795.0K
-625.98%
jan 1, 2013
974.0K
+306.0K
45.81%
jan 1, 2014
1.811 mln
+837.0K
85.93%
jan 1, 2015
2.188 mln
+377.0K
20.82%
jan 1, 2016
6.967 mln
+4.779 mln
218.42%
Ranking of countries by current statistics by years


Comments: