29
/
en
AIzaSyAYiBZKx7MnpbEhh9jyipgxe19OcubqV5w
April 1, 2024
126558
El Salvador
SLV
true
2
1
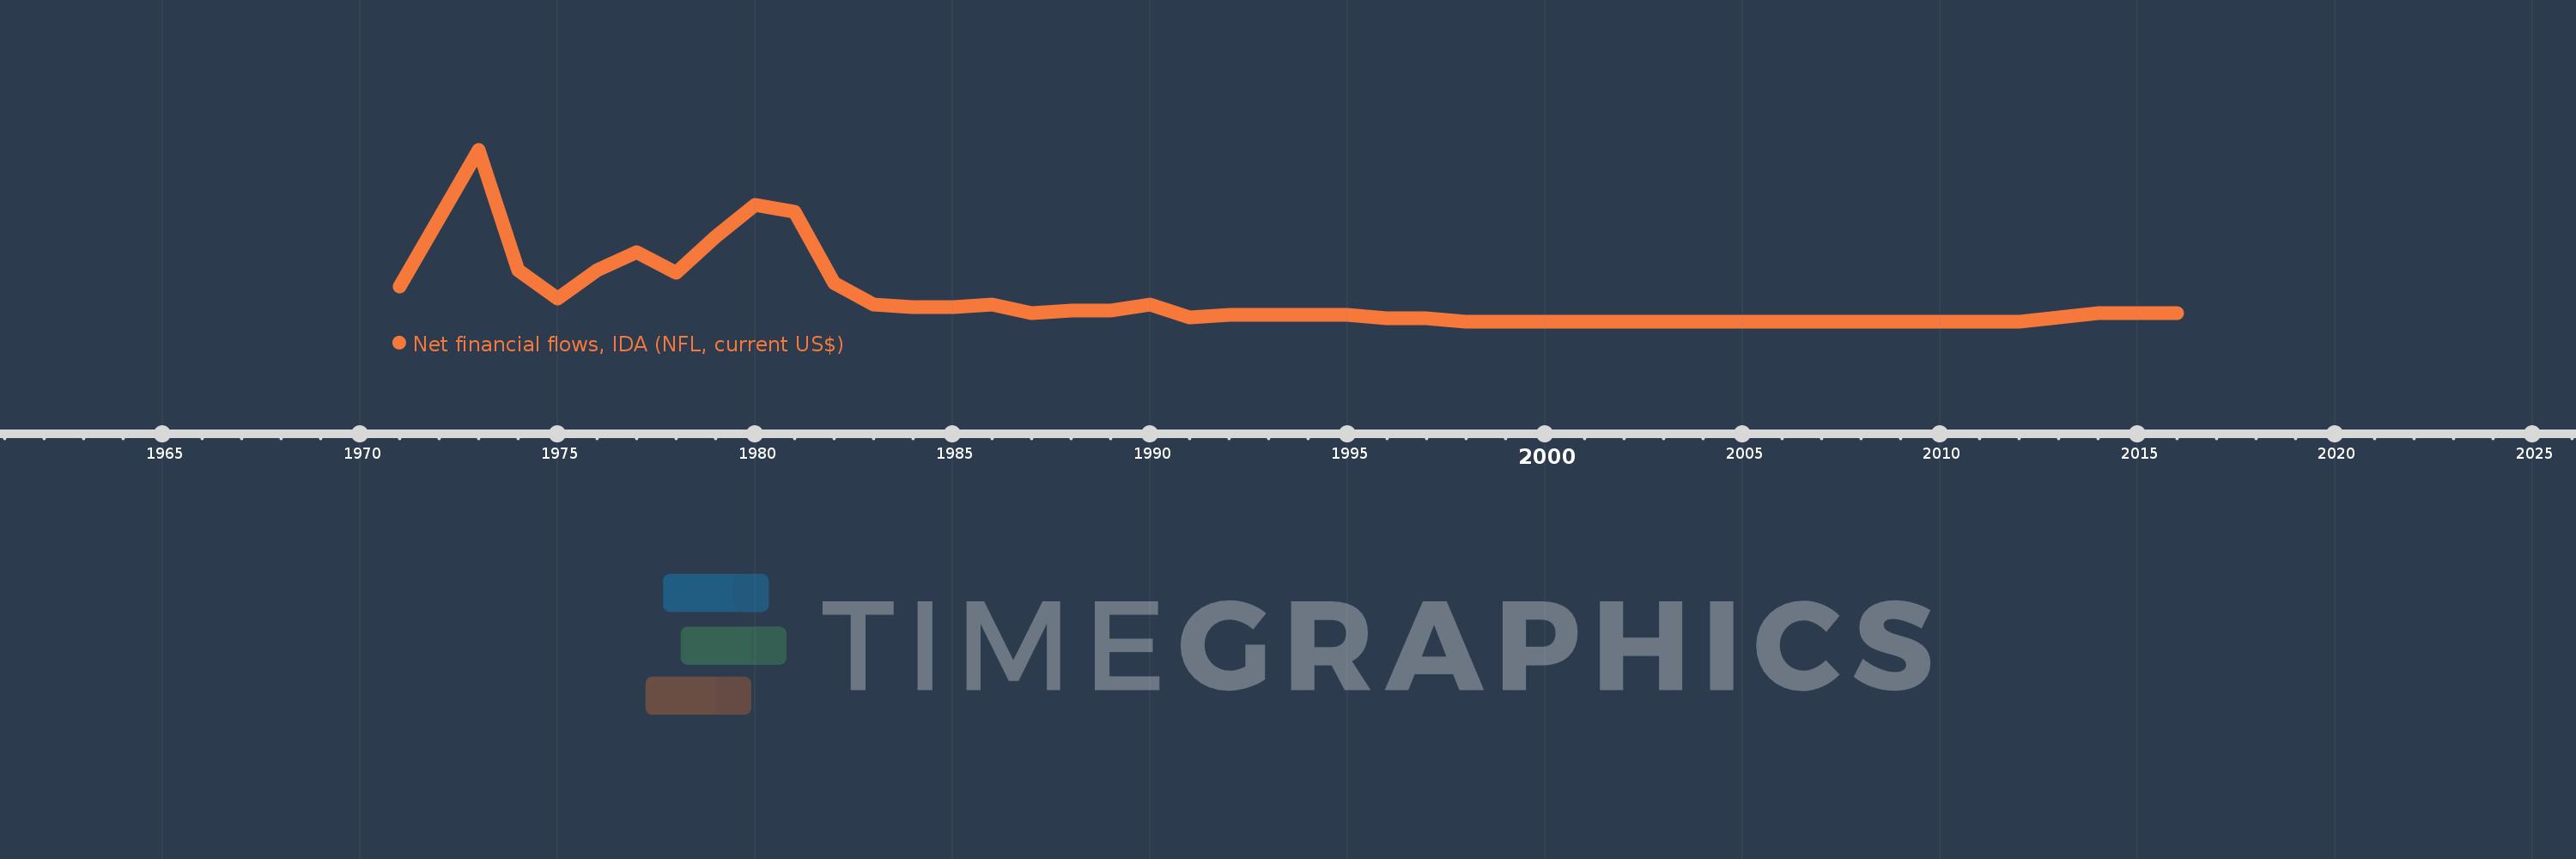
Net financial flows, IDA (NFL, current US$)
2016,2015,2014,2013,2012,2011,2010,2009,2008,2007,2006,2005,2004,2003,2002,2001,2000,1999,1998,1997,1996,1995,1994,1993,1992,1991,1990,1989,1988,1987,1986,1985,1984,1983,1982,1981,1980,1979,1978,1977,1976,1975,1974,1973,1971
This statistics in other country:
Timeline:
This timeline shows a graph from 1971 to 2016 of El Salvador. No data until 1970. Number of actual observations by date: 45.
Source name:
World Development Indicators
Source organization:
World Bank, International Debt Statistics.
Categories, topics:
External Debt
Last updated:
apr 23, 2017
Indicators value changes by year
Minimum:
-840.0K
jan 1, 1998
Maximum:
4.792 mln
jan 1, 1973
At the date of observation
Value
Absolute change
Change from previous value
jan 1, 1971
326.0K
+326.0K
0.0%
jan 1, 1973
4.792 mln
+4.466 mln
1.37K%
jan 1, 1974
853.0K
-3.939 mln
-82.2%
jan 1, 1975
-75.0K
-928.0K
-108.79%
jan 1, 1976
855.0K
+930.0K
-1.24K%
jan 1, 1977
1.455 mln
+600.0K
70.18%
jan 1, 1978
781.0K
-674.0K
-46.32%
jan 1, 1979
1.963 mln
+1.182 mln
151.34%
jan 1, 1980
2.998 mln
+1.035 mln
52.73%
jan 1, 1981
2.76 mln
-238.0K
-7.94%
jan 1, 1982
447.0K
-2.313 mln
-83.8%
jan 1, 1983
-256.0K
-703.0K
-157.27%
jan 1, 1984
-353.0K
-97.0K
37.89%
jan 1, 1985
-353.0K
0.0
0.0%
jan 1, 1986
-268.0K
+85.0K
-24.08%
jan 1, 1987
-559.0K
-291.0K
108.58%
jan 1, 1988
-473.0K
+86.0K
-15.38%
jan 1, 1989
-473.0K
0.0
0.0%
jan 1, 1990
-268.0K
+205.0K
-43.34%
jan 1, 1991
-678.0K
-410.0K
152.99%
jan 1, 1992
-600.0K
+78.0K
-11.5%
jan 1, 1993
-600.0K
0.0
0.0%
jan 1, 1994
-600.0K
0.0
0.0%
jan 1, 1995
-600.0K
0.0
0.0%
jan 1, 1996
-720.0K
-120.0K
20.0%
jan 1, 1997
-720.0K
0.0
0.0%
jan 1, 1998
-840.0K
-120.0K
16.67%
jan 1, 1999
-840.0K
0.0
0.0%
jan 1, 2000
-840.0K
0.0
0.0%
jan 1, 2001
-840.0K
0.0
0.0%
jan 1, 2002
-840.0K
0.0
0.0%
jan 1, 2003
-840.0K
0.0
0.0%
jan 1, 2004
-840.0K
0.0
0.0%
jan 1, 2005
-840.0K
0.0
0.0%
jan 1, 2006
-840.0K
0.0
0.0%
jan 1, 2007
-840.0K
0.0
0.0%
jan 1, 2008
-840.0K
0.0
0.0%
jan 1, 2009
-840.0K
0.0
0.0%
jan 1, 2010
-840.0K
0.0
0.0%
jan 1, 2011
-840.0K
0.0
0.0%
jan 1, 2012
-840.0K
0.0
0.0%
jan 1, 2013
-695.0K
+145.0K
-17.26%
jan 1, 2014
-550.0K
+145.0K
-20.86%
jan 1, 2015
-550.0K
0.0
0.0%
jan 1, 2016
-550.0K
0.0
0.0%
Ranking of countries by current statistics by years


Comments: