29
/
en
AIzaSyAYiBZKx7MnpbEhh9jyipgxe19OcubqV5w
April 1, 2024
112625
Costa Rica
CRI
true
2
1
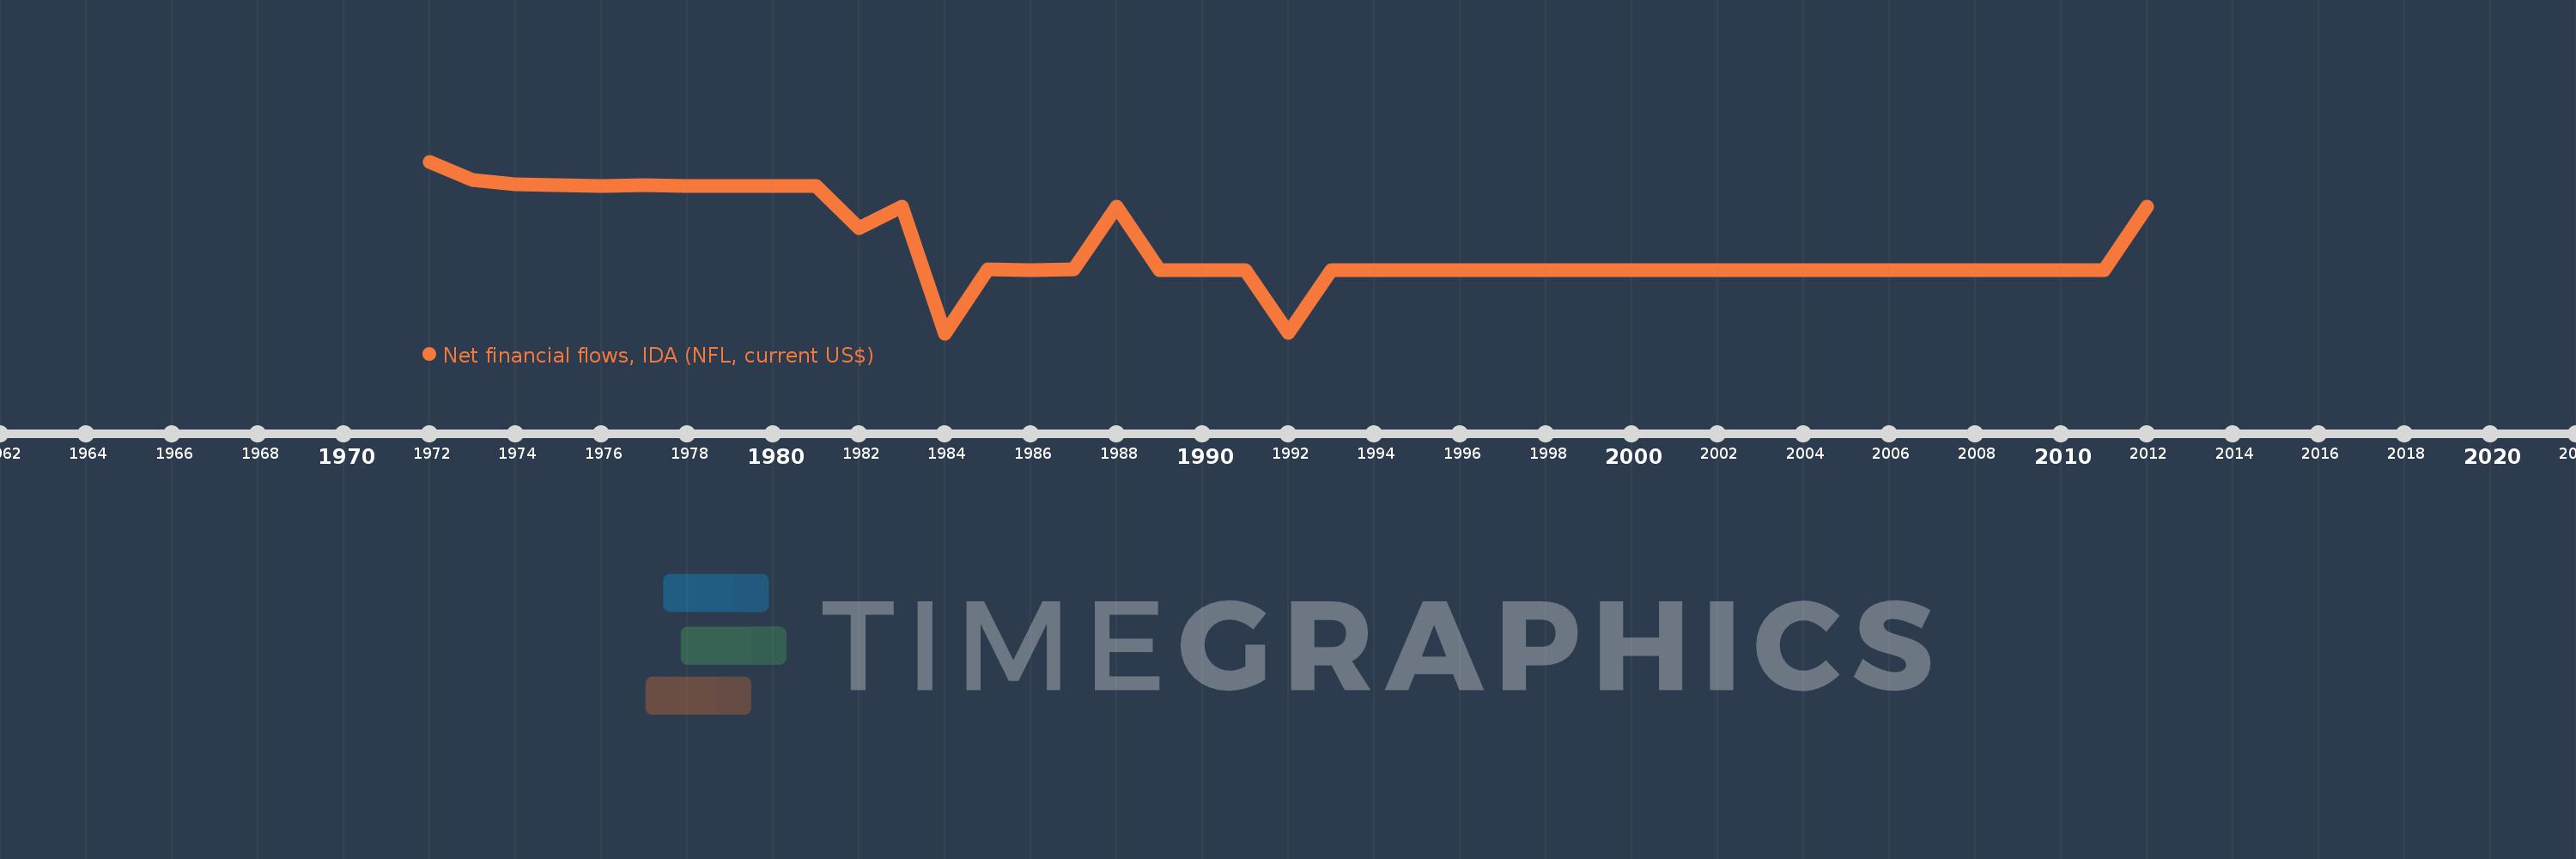
Net financial flows, IDA (NFL, current US$)
2012,2011,2010,2009,2008,2007,2006,2005,2004,2003,2002,2001,2000,1999,1998,1997,1996,1995,1994,1993,1992,1991,1990,1989,1988,1987,1986,1985,1984,1983,1982,1981,1980,1979,1978,1977,1976,1975,1974,1973,1972
This statistics in other country:
Timeline:
This timeline shows a graph from 1972 to 2012 of Costa Rica. No data until 1971. Number of actual observations by date: 41.
Source name:
World Development Indicators
Source organization:
World Bank, International Debt Statistics.
Categories, topics:
External Debt
Last updated:
apr 23, 2017
Indicators value changes by year
Minimum:
-248.0K
jan 1, 1984
Maximum:
-23.0K
jan 1, 1972
At the date of observation
Value
Absolute change
Change from previous value
jan 1, 1972
-23.0K
-23.0K
0.0%
jan 1, 1973
-47.0K
-24.0K
104.35%
jan 1, 1974
-53.0K
-6.0K
12.77%
jan 1, 1975
-54.0K
-1000.0
1.89%
jan 1, 1976
-55.0K
-1000.0
1.85%
jan 1, 1977
-54.0K
+1000.0
-1.82%
jan 1, 1978
-55.0K
-1000.0
1.85%
jan 1, 1979
-55.0K
0.0
0.0%
jan 1, 1980
-55.0K
0.0
0.0%
jan 1, 1981
-55.0K
0.0
0.0%
jan 1, 1982
-110.0K
-55.0K
100.0%
jan 1, 1983
-82.0K
+28.0K
-25.45%
jan 1, 1984
-248.0K
-166.0K
202.44%
jan 1, 1985
-164.0K
+84.0K
-33.87%
jan 1, 1986
-165.0K
-1000.0
0.61%
jan 1, 1987
-164.0K
+1000.0
-0.61%
jan 1, 1988
-82.0K
+82.0K
-50.0%
jan 1, 1989
-165.0K
-83.0K
101.22%
jan 1, 1990
-165.0K
0.0
0.0%
jan 1, 1991
-165.0K
0.0
0.0%
jan 1, 1992
-247.0K
-82.0K
49.7%
jan 1, 1993
-165.0K
+82.0K
-33.2%
jan 1, 1994
-165.0K
0.0
0.0%
jan 1, 1995
-165.0K
0.0
0.0%
jan 1, 1996
-165.0K
0.0
0.0%
jan 1, 1997
-165.0K
0.0
0.0%
jan 1, 1998
-165.0K
0.0
0.0%
jan 1, 1999
-165.0K
0.0
0.0%
jan 1, 2000
-165.0K
0.0
0.0%
jan 1, 2001
-165.0K
0.0
0.0%
jan 1, 2002
-165.0K
0.0
0.0%
jan 1, 2003
-165.0K
0.0
0.0%
jan 1, 2004
-165.0K
0.0
0.0%
jan 1, 2005
-165.0K
0.0
0.0%
jan 1, 2006
-165.0K
0.0
0.0%
jan 1, 2007
-165.0K
0.0
0.0%
jan 1, 2008
-165.0K
0.0
0.0%
jan 1, 2009
-165.0K
0.0
0.0%
jan 1, 2010
-165.0K
0.0
0.0%
jan 1, 2011
-165.0K
0.0
0.0%
jan 1, 2012
-82.0K
+83.0K
-50.3%
Ranking of countries by current statistics by years


Comments: