29
/
en
AIzaSyAYiBZKx7MnpbEhh9jyipgxe19OcubqV5w
April 1, 2024
252196
St. Vincent and the Grenadines
VCT
true
2
1
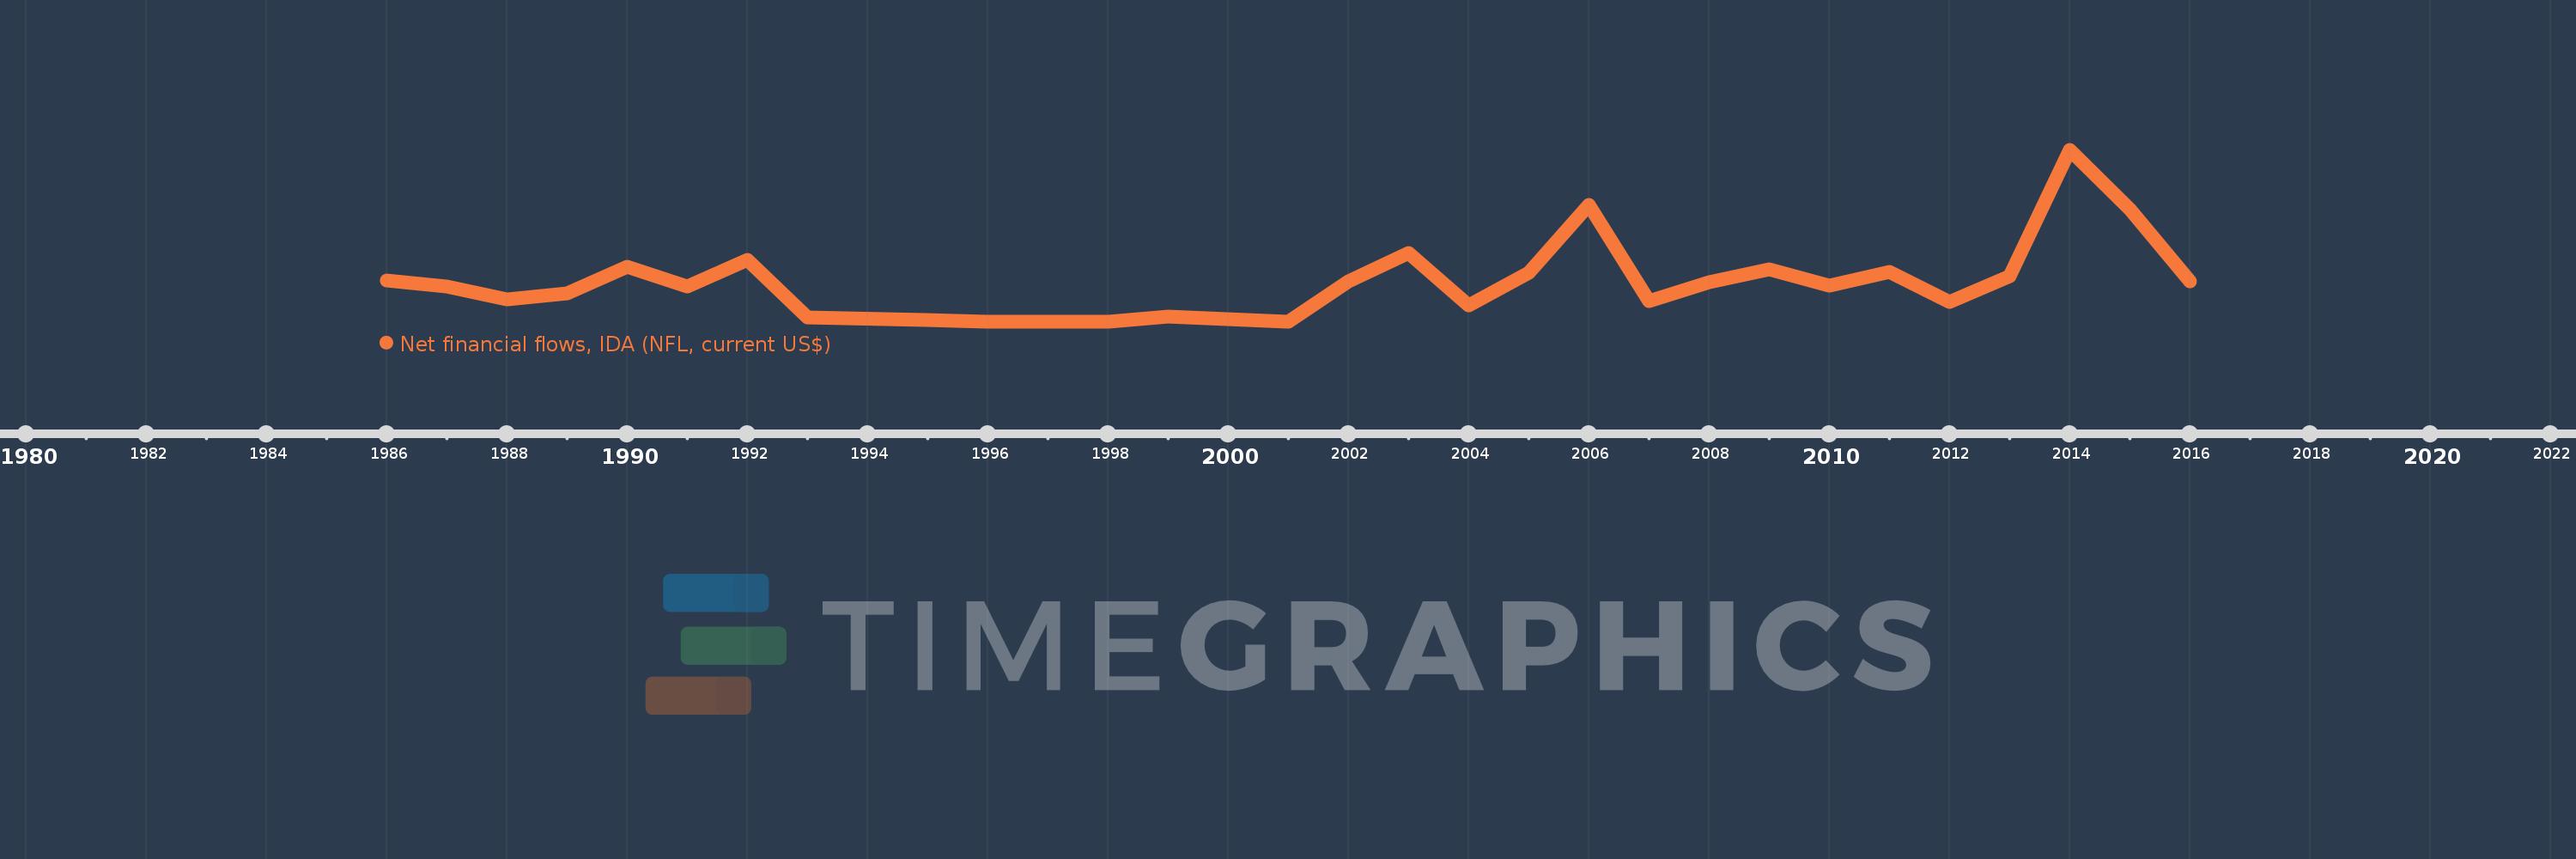
Net financial flows, IDA (NFL, current US$)
2016,2015,2014,2013,2012,2011,2010,2009,2008,2007,2006,2005,2004,2003,2002,2001,2000,1999,1998,1997,1996,1995,1993,1992,1991,1990,1989,1988,1987,1986
This statistics in other country:
Timeline:
This timeline shows a graph from 1986 to 2016 of St. Vincent and the Grenadines. No data until 1985. Number of actual observations by date: 30.
Source name:
World Development Indicators
Source organization:
World Bank, International Debt Statistics.
Categories, topics:
External Debt
Last updated:
apr 23, 2017
Indicators value changes by year
Minimum:
-75.0K
jan 1, 2001
Maximum:
4.461 mln
jan 1, 2014
At the date of observation
Value
Absolute change
Change from previous value
jan 1, 1986
1.016 mln
+1.016 mln
0.0%
jan 1, 1987
870.0K
-146.0K
-14.37%
jan 1, 1988
526.0K
-344.0K
-39.54%
jan 1, 1989
669.0K
+143.0K
27.19%
jan 1, 1990
1.385 mln
+716.0K
107.03%
jan 1, 1991
858.0K
-527.0K
-38.05%
jan 1, 1992
1.576 mln
+718.0K
83.68%
jan 1, 1993
42.0K
-1.534 mln
-97.34%
jan 1, 1995
-32.0K
-74.0K
-176.19%
jan 1, 1996
-68.0K
-36.0K
112.5%
jan 1, 1997
-64.0K
+4.0K
-5.88%
jan 1, 1998
-61.0K
+3.0K
-4.69%
jan 1, 1999
60.0K
+121.0K
-198.36%
jan 1, 2000
2.0K
-58.0K
-96.67%
jan 1, 2001
-75.0K
-77.0K
-3.85K%
jan 1, 2002
1.001 mln
+1.076 mln
-1.43K%
jan 1, 2003
1.741 mln
+740.0K
73.93%
jan 1, 2004
371.0K
-1.37 mln
-78.69%
jan 1, 2005
1.222 mln
+851.0K
229.38%
jan 1, 2006
3.024 mln
+1.802 mln
147.46%
jan 1, 2007
470.0K
-2.554 mln
-84.46%
jan 1, 2008
965.0K
+495.0K
105.32%
jan 1, 2009
1.326 mln
+361.0K
37.41%
jan 1, 2010
893.0K
-433.0K
-32.65%
jan 1, 2011
1.246 mln
+353.0K
39.53%
jan 1, 2012
459.0K
-787.0K
-63.16%
jan 1, 2013
1.131 mln
+672.0K
146.41%
jan 1, 2014
4.461 mln
+3.33 mln
294.43%
jan 1, 2015
2.893 mln
-1.568 mln
-35.15%
jan 1, 2016
997.0K
-1.896 mln
-65.54%
Ranking of countries by current statistics by years


Comments: