29
/
en
AIzaSyAYiBZKx7MnpbEhh9jyipgxe19OcubqV5w
April 1, 2024
137077
Gambia, The
GMB
true
2
1
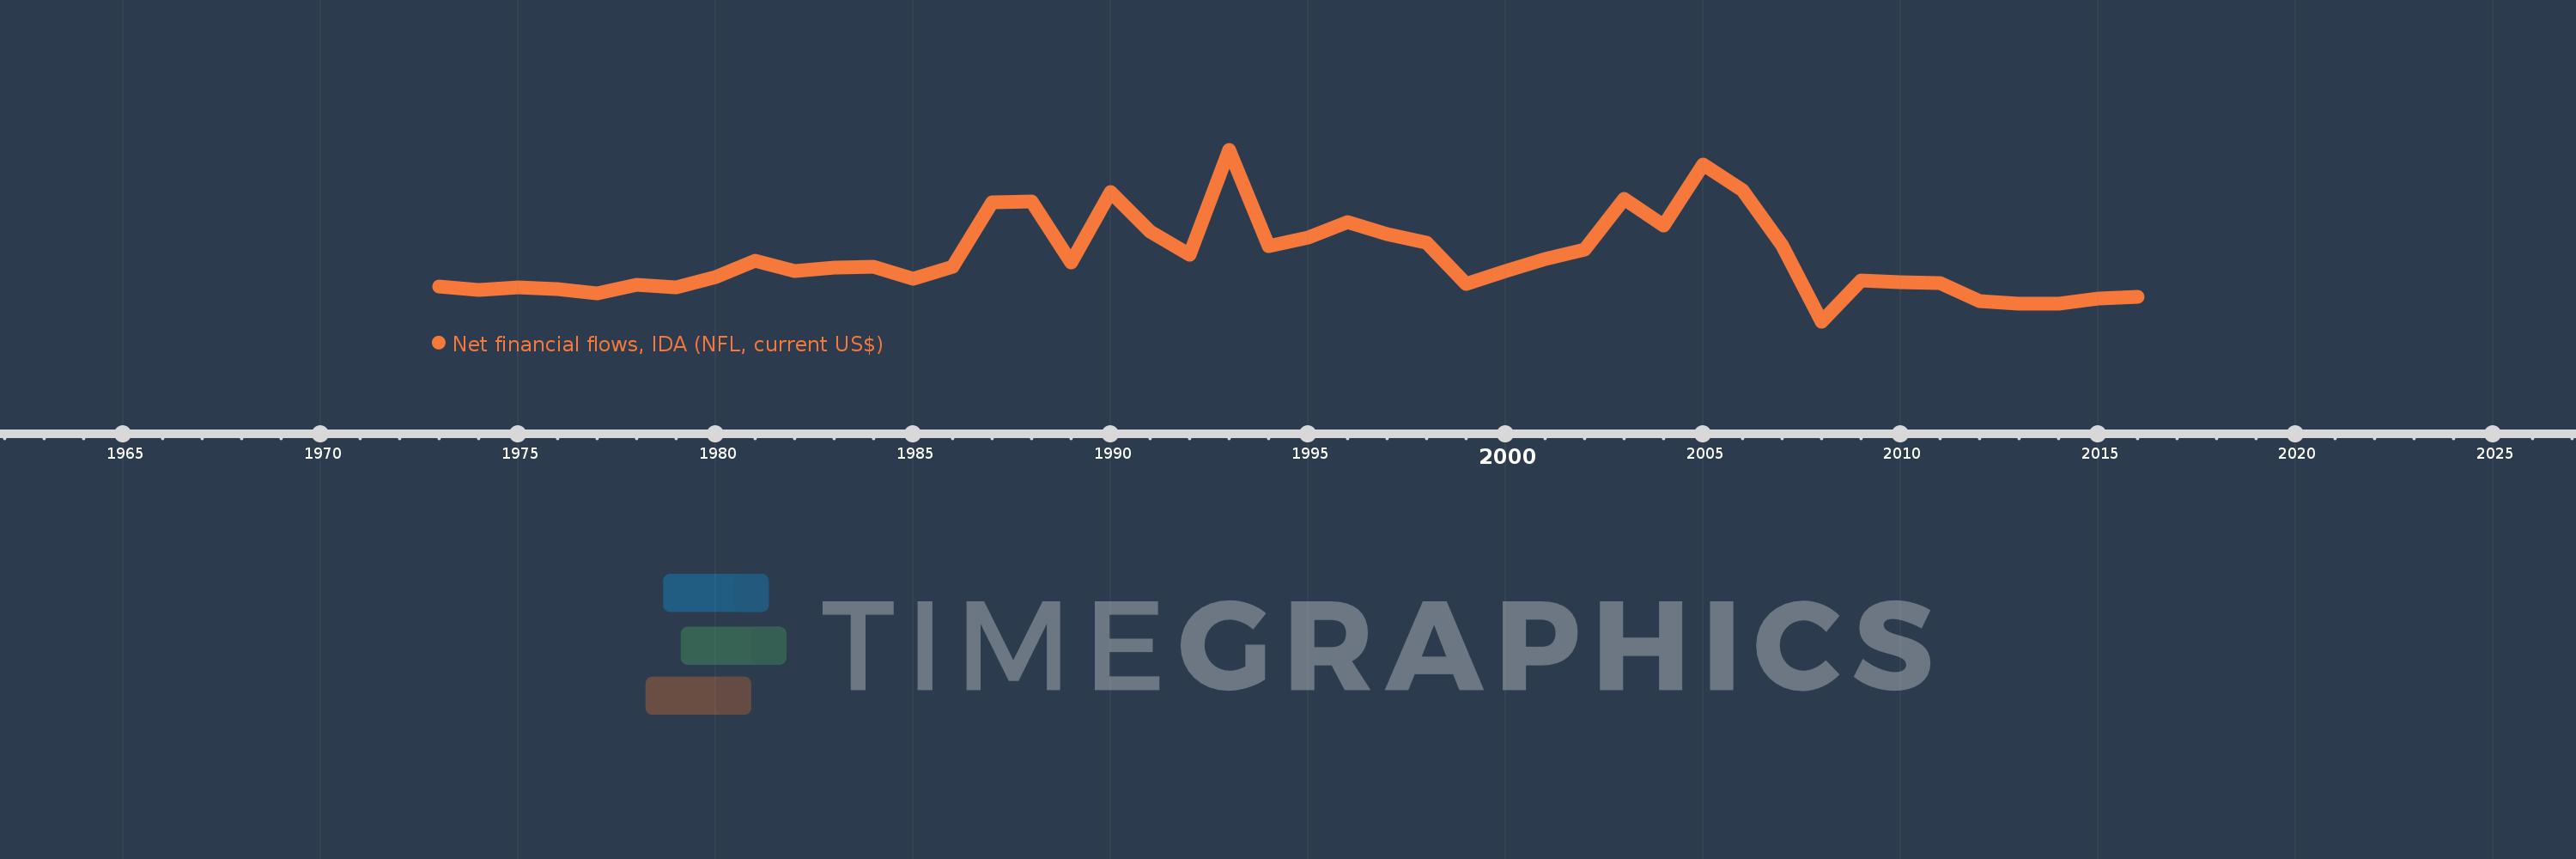
Net financial flows, IDA (NFL, current US$)
2016,2015,2014,2013,2012,2011,2010,2009,2008,2007,2006,2005,2004,2003,2002,2001,2000,1999,1998,1997,1996,1995,1994,1993,1992,1991,1990,1989,1988,1987,1986,1985,1984,1983,1982,1981,1980,1979,1978,1977,1976,1975,1974,1973
This statistics in other country:
Timeline:
This timeline shows a graph from 1973 to 2016 of Gambia, The. No data until 1972. Number of actual observations by date: 44.
Source name:
World Development Indicators
Source organization:
World Bank, International Debt Statistics.
Categories, topics:
External Debt
Last updated:
apr 23, 2017
Indicators value changes by year
Minimum:
-3.869 mln
jan 1, 2008
Maximum:
21.446 mln
jan 1, 1993
At the date of observation
Value
Absolute change
Change from previous value
jan 1, 1973
1.419 mln
+1.419 mln
0.0%
jan 1, 1974
909.0K
-510.0K
-35.94%
jan 1, 1975
1.216 mln
+307.0K
33.77%
jan 1, 1976
964.0K
-252.0K
-20.72%
jan 1, 1977
404.0K
-560.0K
-58.09%
jan 1, 1978
1.631 mln
+1.227 mln
303.71%
jan 1, 1979
1.251 mln
-380.0K
-23.3%
jan 1, 1980
2.803 mln
+1.552 mln
124.06%
jan 1, 1981
5.172 mln
+2.369 mln
84.52%
jan 1, 1982
3.625 mln
-1.547 mln
-29.91%
jan 1, 1983
4.185 mln
+560.0K
15.45%
jan 1, 1984
4.331 mln
+146.0K
3.49%
jan 1, 1985
2.457 mln
-1.874 mln
-43.27%
jan 1, 1986
4.247 mln
+1.79 mln
72.85%
jan 1, 1987
13.722 mln
+9.475 mln
223.1%
jan 1, 1988
13.938 mln
+216.0K
1.57%
jan 1, 1989
4.901 mln
-9.037 mln
-64.84%
jan 1, 1990
15.256 mln
+10.355 mln
211.28%
jan 1, 1991
9.51 mln
-5.746 mln
-37.66%
jan 1, 1992
6.096 mln
-3.414 mln
-35.9%
jan 1, 1993
21.446 mln
+15.35 mln
251.8%
jan 1, 1994
7.263 mln
-14.183 mln
-66.13%
jan 1, 1995
8.598 mln
+1.335 mln
18.38%
jan 1, 1996
10.873 mln
+2.275 mln
26.46%
jan 1, 1997
9.064 mln
-1.809 mln
-16.64%
jan 1, 1998
7.842 mln
-1.222 mln
-13.48%
jan 1, 1999
1.679 mln
-6.163 mln
-78.59%
jan 1, 2000
3.645 mln
+1.966 mln
117.09%
jan 1, 2001
5.44 mln
+1.795 mln
49.25%
jan 1, 2002
6.859 mln
+1.419 mln
26.08%
jan 1, 2003
14.263 mln
+7.404 mln
107.95%
jan 1, 2004
10.353 mln
-3.91 mln
-27.41%
jan 1, 2005
19.393 mln
+9.04 mln
87.32%
jan 1, 2006
15.583 mln
-3.81 mln
-19.65%
jan 1, 2007
7.465 mln
-8.118 mln
-52.1%
jan 1, 2008
-3.869 mln
-11.334 mln
-151.83%
jan 1, 2009
2.297 mln
+6.166 mln
-159.37%
jan 1, 2010
2.01 mln
-287.0K
-12.49%
jan 1, 2011
1.874 mln
-136.0K
-6.77%
jan 1, 2012
-762.0K
-2.636 mln
-140.66%
jan 1, 2013
-1.186 mln
-424.0K
55.64%
jan 1, 2014
-1.18 mln
+6.0K
-0.51%
jan 1, 2015
-473.0K
+707.0K
-59.92%
jan 1, 2016
-211.0K
+262.0K
-55.39%
Ranking of countries by current statistics by years


Comments: