29
/
en
AIzaSyAYiBZKx7MnpbEhh9jyipgxe19OcubqV5w
April 1, 2024
84452
Benin
BEN
true
2
1
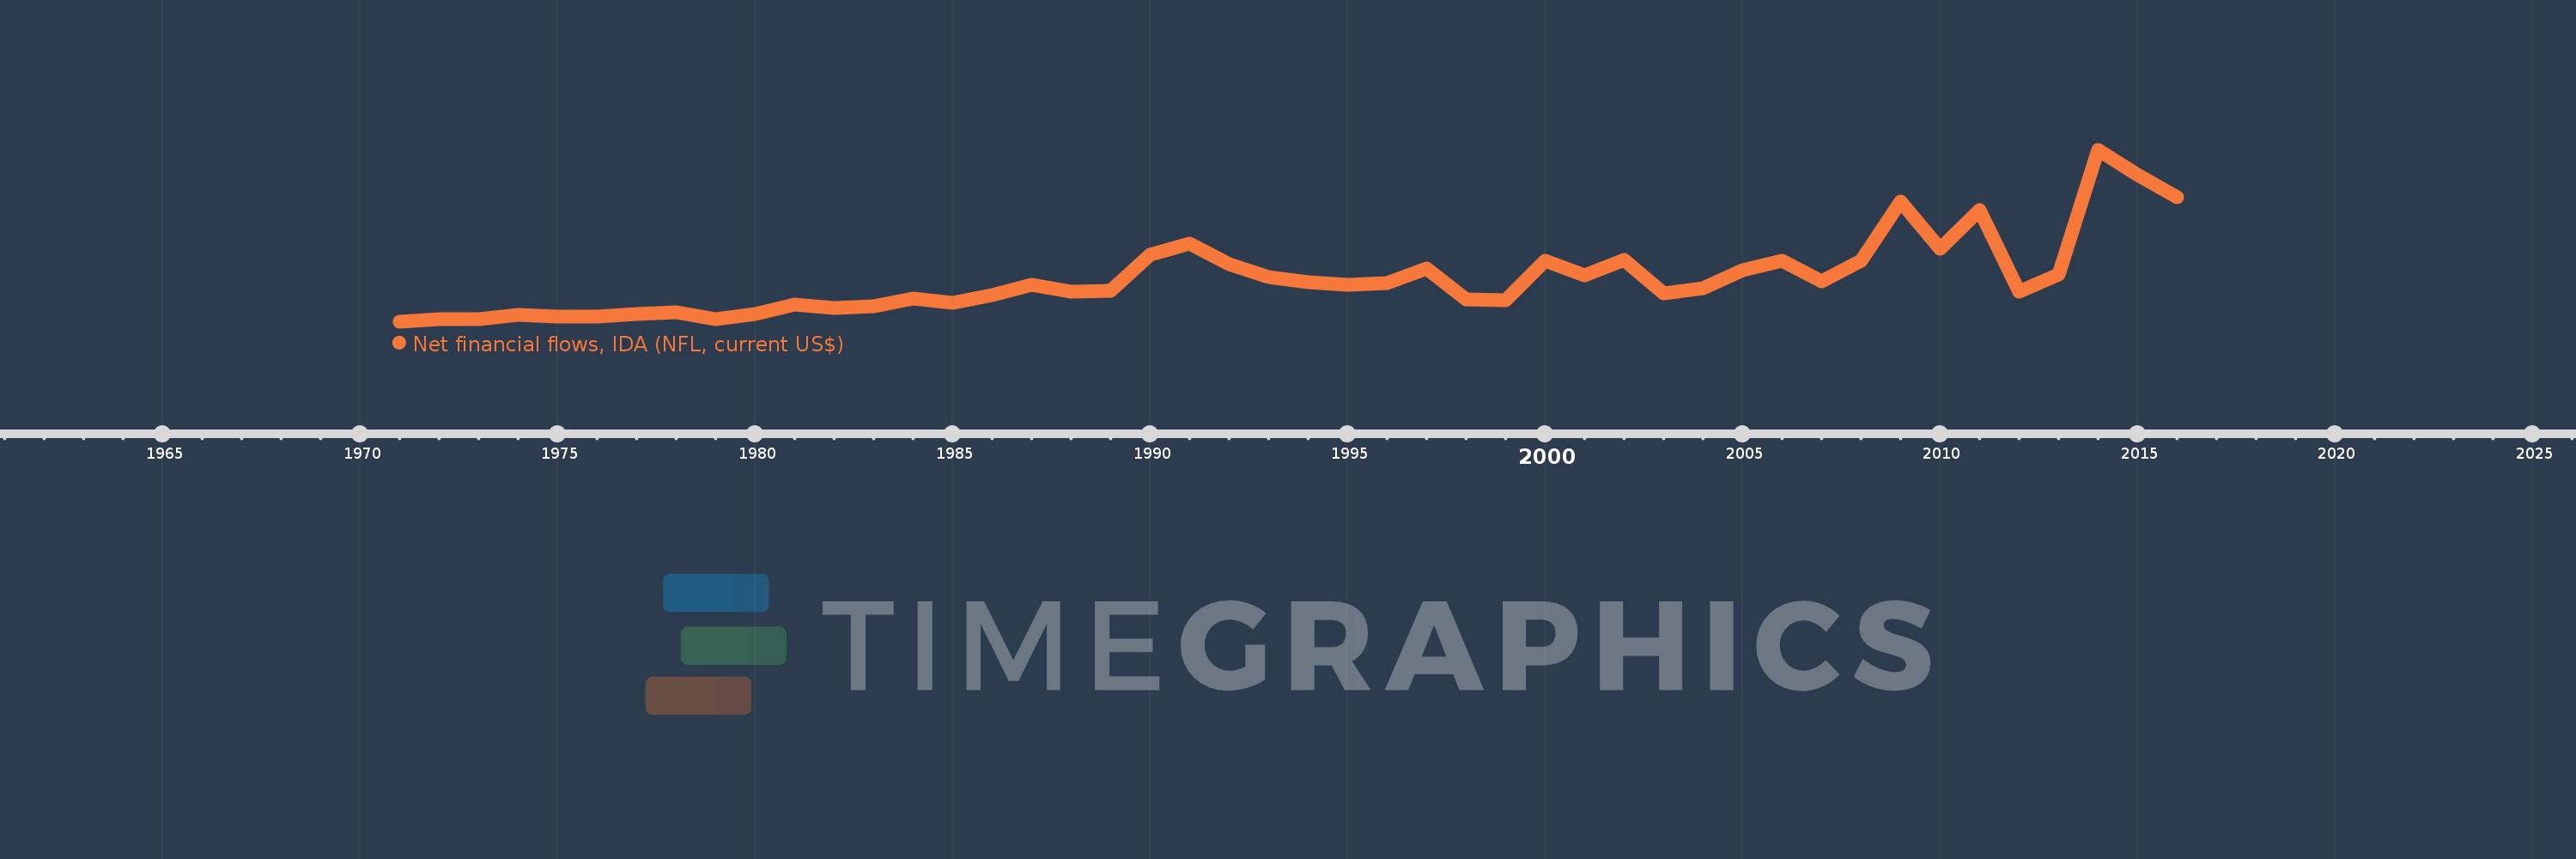
Net financial flows, IDA (NFL, current US$)
2016,2015,2014,2013,2012,2011,2010,2009,2008,2007,2006,2005,2004,2003,2002,2001,2000,1999,1998,1997,1996,1995,1994,1993,1992,1991,1990,1989,1988,1987,1986,1985,1984,1983,1982,1981,1980,1979,1978,1977,1976,1975,1974,1973,1972,1971
This statistics in other country:
Timeline:
This timeline shows a graph from 1971 to 2016 of Benin. No data until 1970. Number of actual observations by date: 46.
Source name:
World Development Indicators
Source organization:
World Bank, International Debt Statistics.
Categories, topics:
External Debt
Last updated:
apr 23, 2017
Indicators value changes by year
Minimum:
145.0K
jan 1, 1971
Maximum:
119.76 mln
jan 1, 2014
At the date of observation
Value
Absolute change
Change from previous value
jan 1, 1971
145.0K
+145.0K
0.0%
jan 1, 1972
2.186 mln
+2.041 mln
1.41K%
jan 1, 1973
2.071 mln
-115.0K
-5.26%
jan 1, 1974
5.272 mln
+3.201 mln
154.56%
jan 1, 1975
4.148 mln
-1.124 mln
-21.32%
jan 1, 1976
4.011 mln
-137.0K
-3.3%
jan 1, 1977
5.929 mln
+1.918 mln
47.82%
jan 1, 1978
7.034 mln
+1.105 mln
18.64%
jan 1, 1979
2.397 mln
-4.637 mln
-65.92%
jan 1, 1980
5.466 mln
+3.069 mln
128.04%
jan 1, 1981
12.232 mln
+6.766 mln
123.78%
jan 1, 1982
9.923 mln
-2.309 mln
-18.88%
jan 1, 1983
10.822 mln
+899.0K
9.06%
jan 1, 1984
16.44 mln
+5.618 mln
51.91%
jan 1, 1985
13.583 mln
-2.857 mln
-17.38%
jan 1, 1986
18.857 mln
+5.274 mln
38.83%
jan 1, 1987
26.333 mln
+7.476 mln
39.65%
jan 1, 1988
21.36 mln
-4.973 mln
-18.89%
jan 1, 1989
21.867 mln
+507.0K
2.37%
jan 1, 1990
46.684 mln
+24.817 mln
113.49%
jan 1, 1991
54.78 mln
+8.096 mln
17.34%
jan 1, 1992
40.451 mln
-14.329 mln
-26.16%
jan 1, 1993
31.361 mln
-9.09 mln
-22.47%
jan 1, 1994
27.966 mln
-3.395 mln
-10.83%
jan 1, 1995
25.931 mln
-2.035 mln
-7.28%
jan 1, 1996
27.46 mln
+1.529 mln
5.9%
jan 1, 1997
37.341 mln
+9.881 mln
35.98%
jan 1, 1998
15.88 mln
-21.461 mln
-57.47%
jan 1, 1999
15.564 mln
-316.0K
-1.99%
jan 1, 2000
42.847 mln
+27.283 mln
175.3%
jan 1, 2001
32.603 mln
-10.244 mln
-23.91%
jan 1, 2002
43.6 mln
+10.997 mln
33.73%
jan 1, 2003
20.107 mln
-23.493 mln
-53.88%
jan 1, 2004
23.456 mln
+3.349 mln
16.66%
jan 1, 2005
36.495 mln
+13.039 mln
55.59%
jan 1, 2006
42.819 mln
+6.324 mln
17.33%
jan 1, 2007
28.428 mln
-14.391 mln
-33.61%
jan 1, 2008
42.501 mln
+14.073 mln
49.5%
jan 1, 2009
84.119 mln
+41.618 mln
97.92%
jan 1, 2010
51.371 mln
-32.748 mln
-38.93%
jan 1, 2011
78.348 mln
+26.977 mln
52.51%
jan 1, 2012
21.115 mln
-57.233 mln
-73.05%
jan 1, 2013
33.05 mln
+11.935 mln
56.52%
jan 1, 2014
119.76 mln
+86.71 mln
262.36%
jan 1, 2015
102.35 mln
-17.41 mln
-14.54%
jan 1, 2016
87.019 mln
-15.331 mln
-14.98%
Ranking of countries by current statistics by years


Comments: