29
/
en
AIzaSyAYiBZKx7MnpbEhh9jyipgxe19OcubqV5w
April 1, 2024
197928
Moldova
MDA
true
2
1
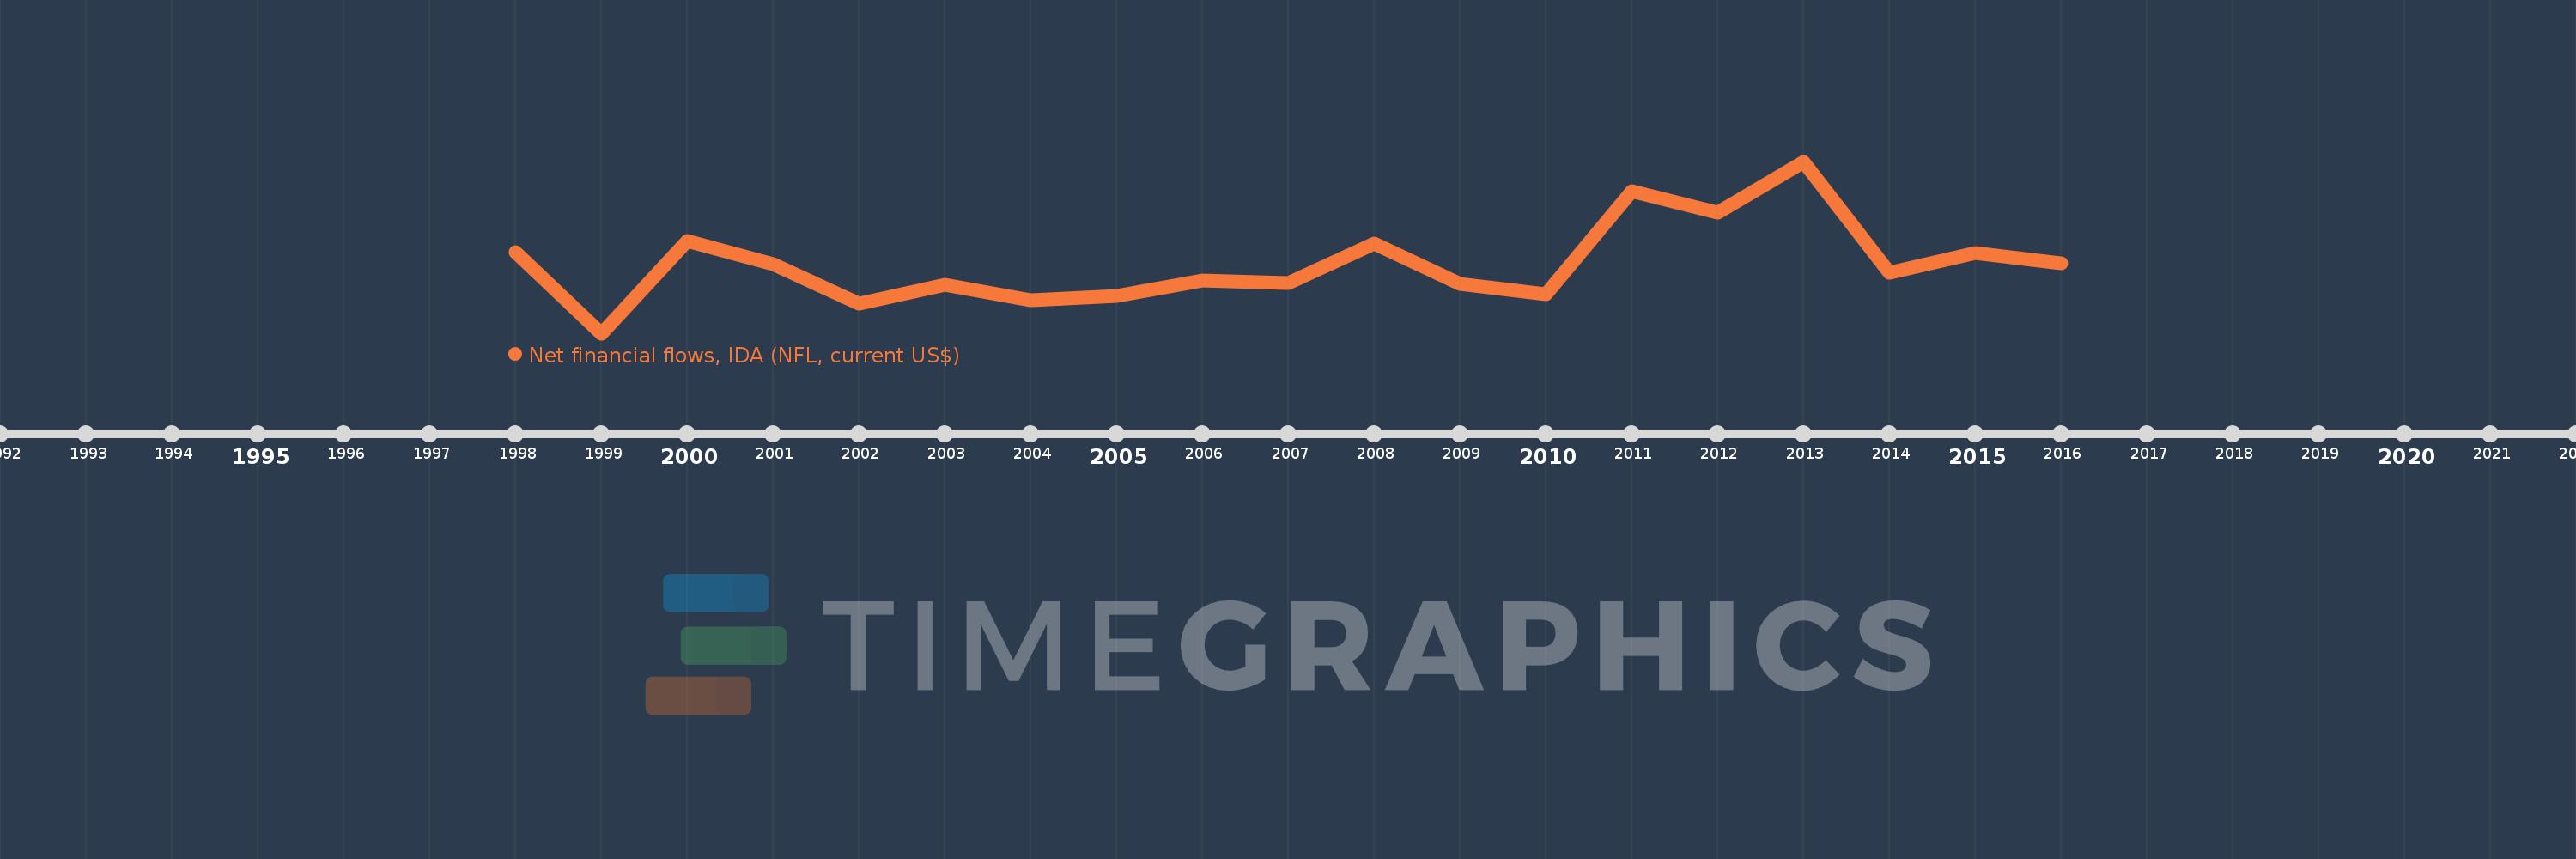
Net financial flows, IDA (NFL, current US$)
2016,2015,2014,2013,2012,2011,2010,2009,2008,2007,2006,2005,2004,2003,2002,2001,2000,1999,1998
This statistics in other country:
Timeline:
This timeline shows a graph from 1998 to 2016 of Moldova. No data until 1997. Number of actual observations by date: 19.
Source name:
World Development Indicators
Source organization:
World Bank, International Debt Statistics.
Categories, topics:
External Debt
Last updated:
apr 23, 2017
Indicators value changes by year
Minimum:
2.258 mln
jan 1, 1999
Maximum:
71.252 mln
jan 1, 2013
At the date of observation
Value
Absolute change
Change from previous value
jan 1, 1998
35.0 mln
+35.0 mln
0.0%
jan 1, 1999
2.258 mln
-32.742 mln
-93.55%
jan 1, 2000
39.27 mln
+37.012 mln
1.64K%
jan 1, 2001
30.083 mln
-9.187 mln
-23.39%
jan 1, 2002
14.156 mln
-15.927 mln
-52.94%
jan 1, 2003
21.87 mln
+7.714 mln
54.49%
jan 1, 2004
15.654 mln
-6.216 mln
-28.42%
jan 1, 2005
17.237 mln
+1.583 mln
10.11%
jan 1, 2006
23.563 mln
+6.326 mln
36.7%
jan 1, 2007
22.568 mln
-995.0K
-4.22%
jan 1, 2008
38.153 mln
+15.585 mln
69.06%
jan 1, 2009
22.19 mln
-15.963 mln
-41.84%
jan 1, 2010
17.985 mln
-4.205 mln
-18.95%
jan 1, 2011
59.366 mln
+41.381 mln
230.09%
jan 1, 2012
50.718 mln
-8.648 mln
-14.57%
jan 1, 2013
71.252 mln
+20.534 mln
40.49%
jan 1, 2014
26.661 mln
-44.591 mln
-62.58%
jan 1, 2015
34.56 mln
+7.899 mln
29.63%
jan 1, 2016
30.215 mln
-4.345 mln
-12.57%
Ranking of countries by current statistics by years


Comments: