29
/
en
AIzaSyAYiBZKx7MnpbEhh9jyipgxe19OcubqV5w
April 1, 2024
154987
India
IND
true
2
1
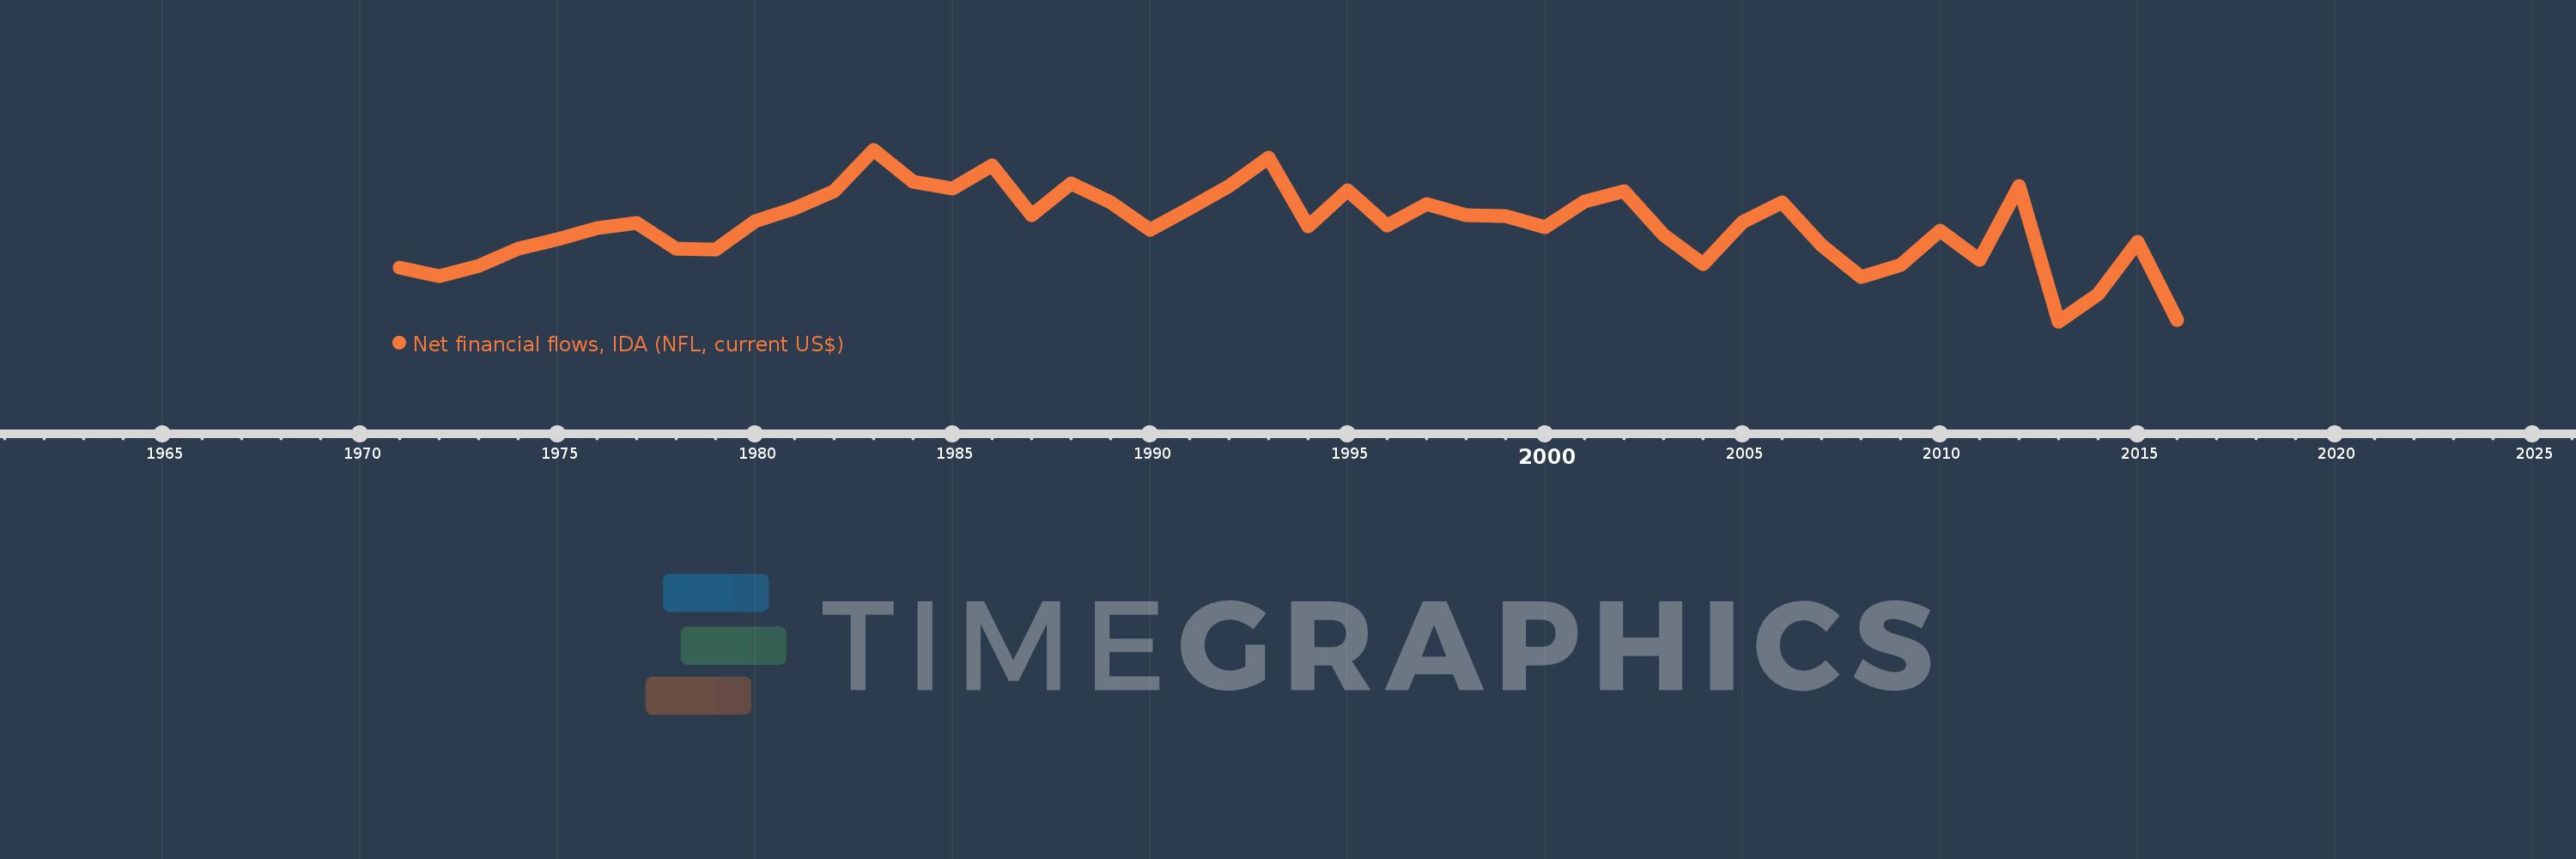
Net financial flows, IDA (NFL, current US$)
2016,2015,2014,2013,2012,2011,2010,2009,2008,2007,2006,2005,2004,2003,2002,2001,2000,1999,1998,1997,1996,1995,1994,1993,1992,1991,1990,1989,1988,1987,1986,1985,1984,1983,1982,1981,1980,1979,1978,1977,1976,1975,1974,1973,1972,1971
This statistics in other country:
Timeline:
This timeline shows a graph from 1971 to 2016 of India. No data until 1970. Number of actual observations by date: 46.
Source name:
World Development Indicators
Source organization:
World Bank, International Debt Statistics.
Categories, topics:
External Debt
Last updated:
apr 23, 2017
Indicators value changes by year
Minimum:
-247.865 mln
jan 1, 2013
Maximum:
1.087 bln
jan 1, 1983
At the date of observation
Value
Absolute change
Change from previous value
jan 1, 1971
172.867 mln
+172.867 mln
0.0%
jan 1, 1972
104.951 mln
-67.916 mln
-39.29%
jan 1, 1973
185.341 mln
+80.39 mln
76.6%
jan 1, 1974
320.125 mln
+134.784 mln
72.72%
jan 1, 1975
394.812 mln
+74.687 mln
23.33%
jan 1, 1976
484.938 mln
+90.126 mln
22.83%
jan 1, 1977
524.368 mln
+39.43 mln
8.13%
jan 1, 1978
322.873 mln
-201.495 mln
-38.43%
jan 1, 1979
316.147 mln
-6.726 mln
-2.08%
jan 1, 1980
533.423 mln
+217.276 mln
68.73%
jan 1, 1981
636.597 mln
+103.174 mln
19.34%
jan 1, 1982
767.582 mln
+130.985 mln
20.58%
jan 1, 1983
1.087 bln
+319.675 mln
41.65%
jan 1, 1984
844.432 mln
-242.825 mln
-22.33%
jan 1, 1985
789.127 mln
-55.305 mln
-6.55%
jan 1, 1986
968.117 mln
+178.99 mln
22.68%
jan 1, 1987
582.038 mln
-386.079 mln
-39.88%
jan 1, 1988
831.544 mln
+249.506 mln
42.87%
jan 1, 1989
681.043 mln
-150.501 mln
-18.1%
jan 1, 1990
467.912 mln
-213.131 mln
-31.29%
jan 1, 1991
634.809 mln
+166.897 mln
35.67%
jan 1, 1992
812.046 mln
+177.237 mln
27.92%
jan 1, 1993
1.03 bln
+218.391 mln
26.89%
jan 1, 1994
495.232 mln
-535.205 mln
-51.94%
jan 1, 1995
772.458 mln
+277.226 mln
55.98%
jan 1, 1996
502.834 mln
-269.624 mln
-34.9%
jan 1, 1997
671.903 mln
+169.069 mln
33.62%
jan 1, 1998
579.879 mln
-92.024 mln
-13.7%
jan 1, 1999
578.463 mln
-1.416 mln
-0.24%
jan 1, 2000
486.11 mln
-92.353 mln
-15.97%
jan 1, 2001
687.789 mln
+201.679 mln
41.49%
jan 1, 2002
766.013 mln
+78.224 mln
11.37%
jan 1, 2003
429.8 mln
-336.213 mln
-43.89%
jan 1, 2004
198.827 mln
-230.973 mln
-53.74%
jan 1, 2005
530.96 mln
+332.133 mln
167.05%
jan 1, 2006
683.237 mln
+152.277 mln
28.68%
jan 1, 2007
351.31 mln
-331.927 mln
-48.58%
jan 1, 2008
102.108 mln
-249.202 mln
-70.94%
jan 1, 2009
196.782 mln
+94.674 mln
92.72%
jan 1, 2010
464.318 mln
+267.536 mln
135.96%
jan 1, 2011
231.541 mln
-232.777 mln
-50.13%
jan 1, 2012
806.407 mln
+574.866 mln
248.28%
jan 1, 2013
-247.865 mln
-1.054 bln
-130.74%
jan 1, 2014
-32.795 mln
+215.07 mln
-86.77%
jan 1, 2015
371.798 mln
+404.593 mln
-1.23K%
jan 1, 2016
-230.506 mln
-602.304 mln
-162.0%
Ranking of countries by current statistics by years


Comments: