29
/
en
AIzaSyAYiBZKx7MnpbEhh9jyipgxe19OcubqV5w
April 1, 2024
56468
Small states
SST
false
2
1
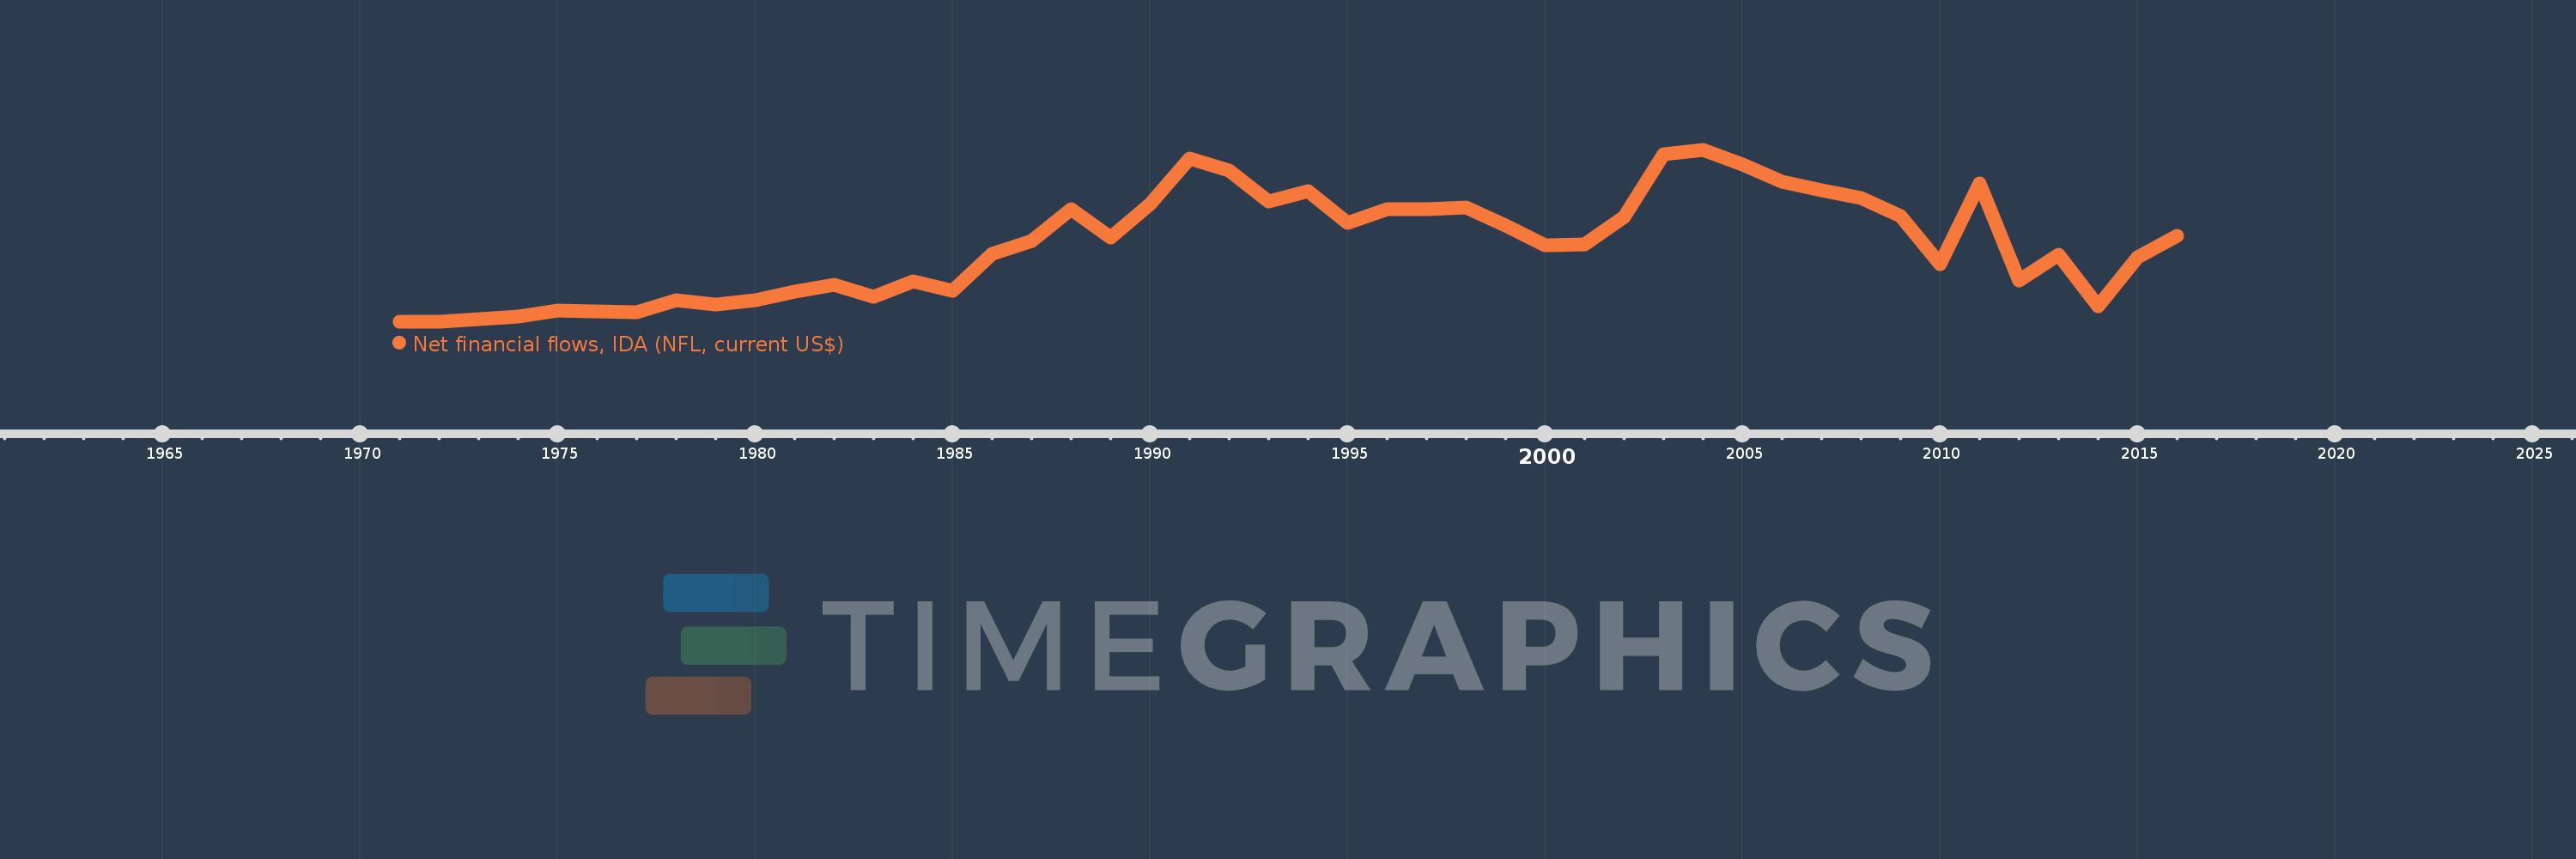
Net financial flows, IDA (NFL, current US$)
2016,2015,2014,2013,2012,2011,2010,2009,2008,2007,2006,2005,2004,2003,2002,2001,2000,1999,1998,1997,1996,1995,1994,1993,1992,1991,1990,1989,1988,1987,1986,1985,1984,1983,1982,1981,1980,1979,1978,1977,1976,1975,1974,1973,1972,1971
This statistics in other country:
Timeline:
This timeline shows a graph from 1971 to 2016 of Small states. No data until 1970. Number of actual observations by date: 46.
Source name:
World Development Indicators
Source organization:
World Bank, International Debt Statistics.
Categories, topics:
External Debt
Last updated:
apr 23, 2017
Indicators value changes by year
Minimum:
1.498 mln
jan 1, 1972
Maximum:
118.392 mln
jan 1, 2004
At the date of observation
Value
Absolute change
Change from previous value
jan 1, 1971
1.906 mln
+1.906 mln
0.0%
jan 1, 1972
1.498 mln
-408.0K
-21.41%
jan 1, 1973
3.46 mln
+1.962 mln
130.97%
jan 1, 1974
5.336 mln
+1.876 mln
54.22%
jan 1, 1975
9.079 mln
+3.743 mln
70.15%
jan 1, 1976
8.606 mln
-473.0K
-5.21%
jan 1, 1977
8.208 mln
-398.0K
-4.62%
jan 1, 1978
16.245 mln
+8.037 mln
97.92%
jan 1, 1979
13.359 mln
-2.886 mln
-17.77%
jan 1, 1980
16.085 mln
+2.726 mln
20.41%
jan 1, 1981
22.189 mln
+6.104 mln
37.95%
jan 1, 1982
26.732 mln
+4.543 mln
20.47%
jan 1, 1983
18.855 mln
-7.877 mln
-29.47%
jan 1, 1984
29.268 mln
+10.413 mln
55.23%
jan 1, 1985
22.718 mln
-6.55 mln
-22.38%
jan 1, 1986
47.784 mln
+25.066 mln
110.33%
jan 1, 1987
56.639 mln
+8.855 mln
18.53%
jan 1, 1988
78.354 mln
+21.716 mln
38.34%
jan 1, 1989
59.044 mln
-19.311 mln
-24.65%
jan 1, 1990
81.793 mln
+22.749 mln
38.53%
jan 1, 1991
112.703 mln
+30.91 mln
37.79%
jan 1, 1992
104.551 mln
-8.152 mln
-7.23%
jan 1, 1993
83.417 mln
-21.134 mln
-20.21%
jan 1, 1994
90.435 mln
+7.018 mln
8.41%
jan 1, 1995
68.991 mln
-21.443 mln
-23.71%
jan 1, 1996
78.089 mln
+9.097 mln
13.19%
jan 1, 1997
78.515 mln
+425.731K
0.55%
jan 1, 1998
79.627 mln
+1.112 mln
1.42%
jan 1, 1999
67.031 mln
-12.595 mln
-15.82%
jan 1, 2000
53.649 mln
-13.383 mln
-19.97%
jan 1, 2001
54.154 mln
+505.85K
0.94%
jan 1, 2002
73.257 mln
+19.102 mln
35.27%
jan 1, 2003
115.632 mln
+42.376 mln
57.85%
jan 1, 2004
118.392 mln
+2.759 mln
2.39%
jan 1, 2005
108.531 mln
-9.86 mln
-8.33%
jan 1, 2006
96.701 mln
-11.831 mln
-10.9%
jan 1, 2007
91.336 mln
-5.365 mln
-5.55%
jan 1, 2008
86.011 mln
-5.325 mln
-5.83%
jan 1, 2009
73.656 mln
-12.355 mln
-14.36%
jan 1, 2010
40.869 mln
-32.787 mln
-44.51%
jan 1, 2011
95.69 mln
+54.821 mln
134.14%
jan 1, 2012
29.691 mln
-65.999 mln
-68.97%
jan 1, 2013
47.2 mln
+17.509 mln
58.97%
jan 1, 2014
12.434 mln
-34.766 mln
-73.66%
jan 1, 2015
45.669 mln
+33.235 mln
267.29%
jan 1, 2016
60.134 mln
+14.465 mln
31.67%
Ranking of countries by current statistics by years


Comments: