29
/
en
AIzaSyAYiBZKx7MnpbEhh9jyipgxe19OcubqV5w
April 1, 2024
262630
Thailand
THA
true
2
1
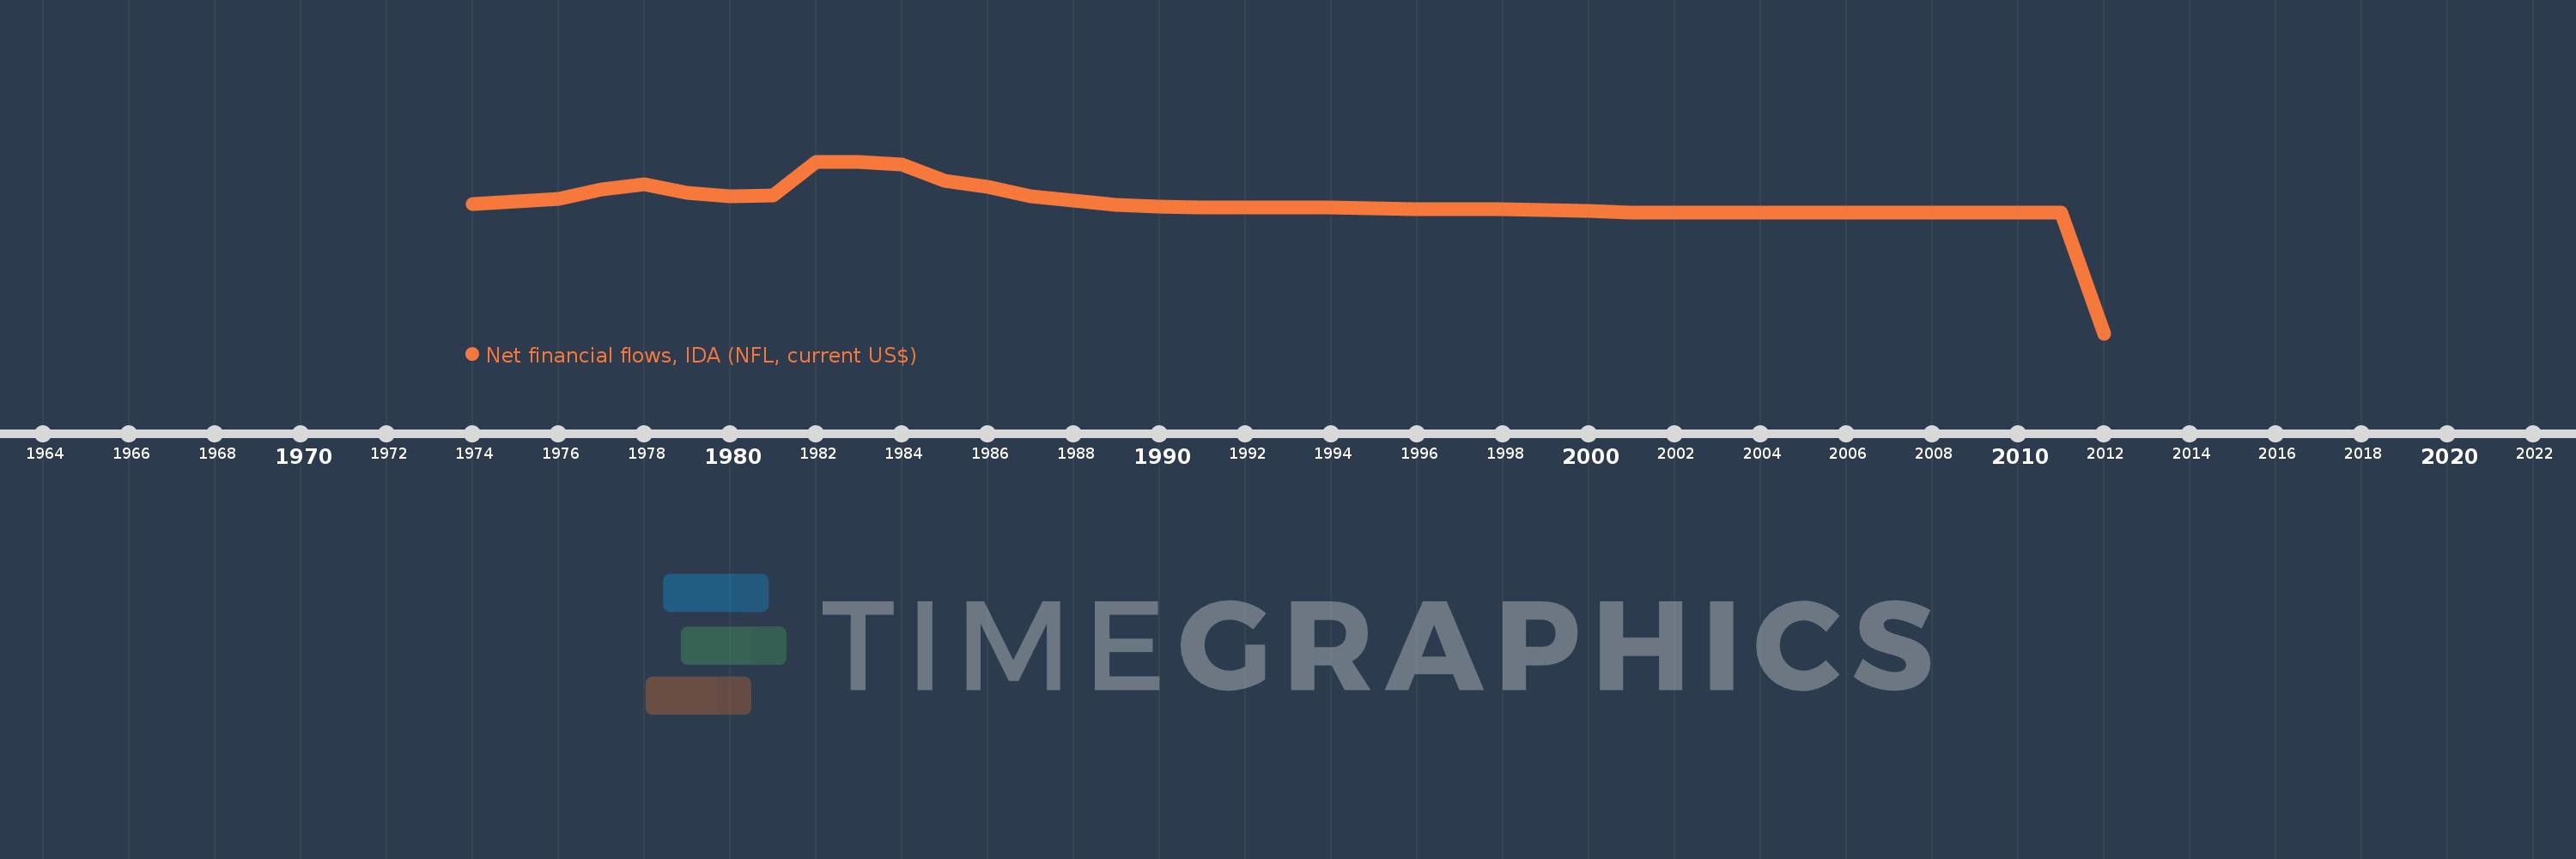
Net financial flows, IDA (NFL, current US$)
2012,2011,2010,2009,2008,2007,2006,2005,2004,2003,2002,2001,2000,1999,1998,1997,1996,1995,1994,1993,1992,1991,1990,1989,1988,1987,1986,1985,1984,1983,1982,1981,1980,1979,1978,1977,1976,1975,1974
This statistics in other country:
Timeline:
This timeline shows a graph from 1974 to 2012 of Thailand. No data until 1973. Number of actual observations by date: 39.
Source name:
World Development Indicators
Source organization:
World Bank, International Debt Statistics.
Categories, topics:
External Debt
Last updated:
apr 23, 2017
Indicators value changes by year
Minimum:
-55.735 mln
jan 1, 2012
Maximum:
18.717 mln
jan 1, 1982
At the date of observation
Value
Absolute change
Change from previous value
jan 1, 1974
172.0K
+172.0K
0.0%
jan 1, 1975
1.263 mln
+1.091 mln
634.3%
jan 1, 1976
2.687 mln
+1.424 mln
112.75%
jan 1, 1977
6.527 mln
+3.84 mln
142.91%
jan 1, 1978
8.756 mln
+2.229 mln
34.15%
jan 1, 1979
5.106 mln
-3.65 mln
-41.69%
jan 1, 1980
3.542 mln
-1.564 mln
-30.63%
jan 1, 1981
4.139 mln
+597.0K
16.85%
jan 1, 1982
18.717 mln
+14.578 mln
352.21%
jan 1, 1983
18.542 mln
-175.0K
-0.93%
jan 1, 1984
17.349 mln
-1.193 mln
-6.43%
jan 1, 1985
10.512 mln
-6.837 mln
-39.41%
jan 1, 1986
7.874 mln
-2.638 mln
-25.1%
jan 1, 1987
3.697 mln
-4.177 mln
-53.05%
jan 1, 1988
1.637 mln
-2.06 mln
-55.72%
jan 1, 1989
35.0K
-1.602 mln
-97.86%
jan 1, 1990
-773.0K
-808.0K
-2.31K%
jan 1, 1991
-1.157 mln
-384.0K
49.68%
jan 1, 1992
-1.126 mln
+31.0K
-2.68%
jan 1, 1993
-1.126 mln
0.0
0.0%
jan 1, 1994
-1.374 mln
-248.0K
22.02%
jan 1, 1995
-1.692 mln
-318.0K
23.14%
jan 1, 1996
-1.761 mln
-69.0K
4.08%
jan 1, 1997
-1.761 mln
0.0
0.0%
jan 1, 1998
-1.761 mln
0.0
0.0%
jan 1, 1999
-2.307 mln
-546.0K
31.01%
jan 1, 2000
-2.841 mln
-534.0K
23.15%
jan 1, 2001
-3.377 mln
-536.0K
18.87%
jan 1, 2002
-3.377 mln
0.0
0.0%
jan 1, 2003
-3.377 mln
0.0
0.0%
jan 1, 2004
-3.377 mln
0.0
0.0%
jan 1, 2005
-3.377 mln
0.0
0.0%
jan 1, 2006
-3.377 mln
0.0
0.0%
jan 1, 2007
-3.377 mln
0.0
0.0%
jan 1, 2008
-3.377 mln
0.0
0.0%
jan 1, 2009
-3.377 mln
0.0
0.0%
jan 1, 2010
-3.377 mln
0.0
0.0%
jan 1, 2011
-3.377 mln
0.0
0.0%
jan 1, 2012
-55.735 mln
-52.358 mln
1.55K%
Ranking of countries by current statistics by years


Comments: