29
/
en
AIzaSyAYiBZKx7MnpbEhh9jyipgxe19OcubqV5w
April 1, 2024
150756
Honduras
HND
true
2
1
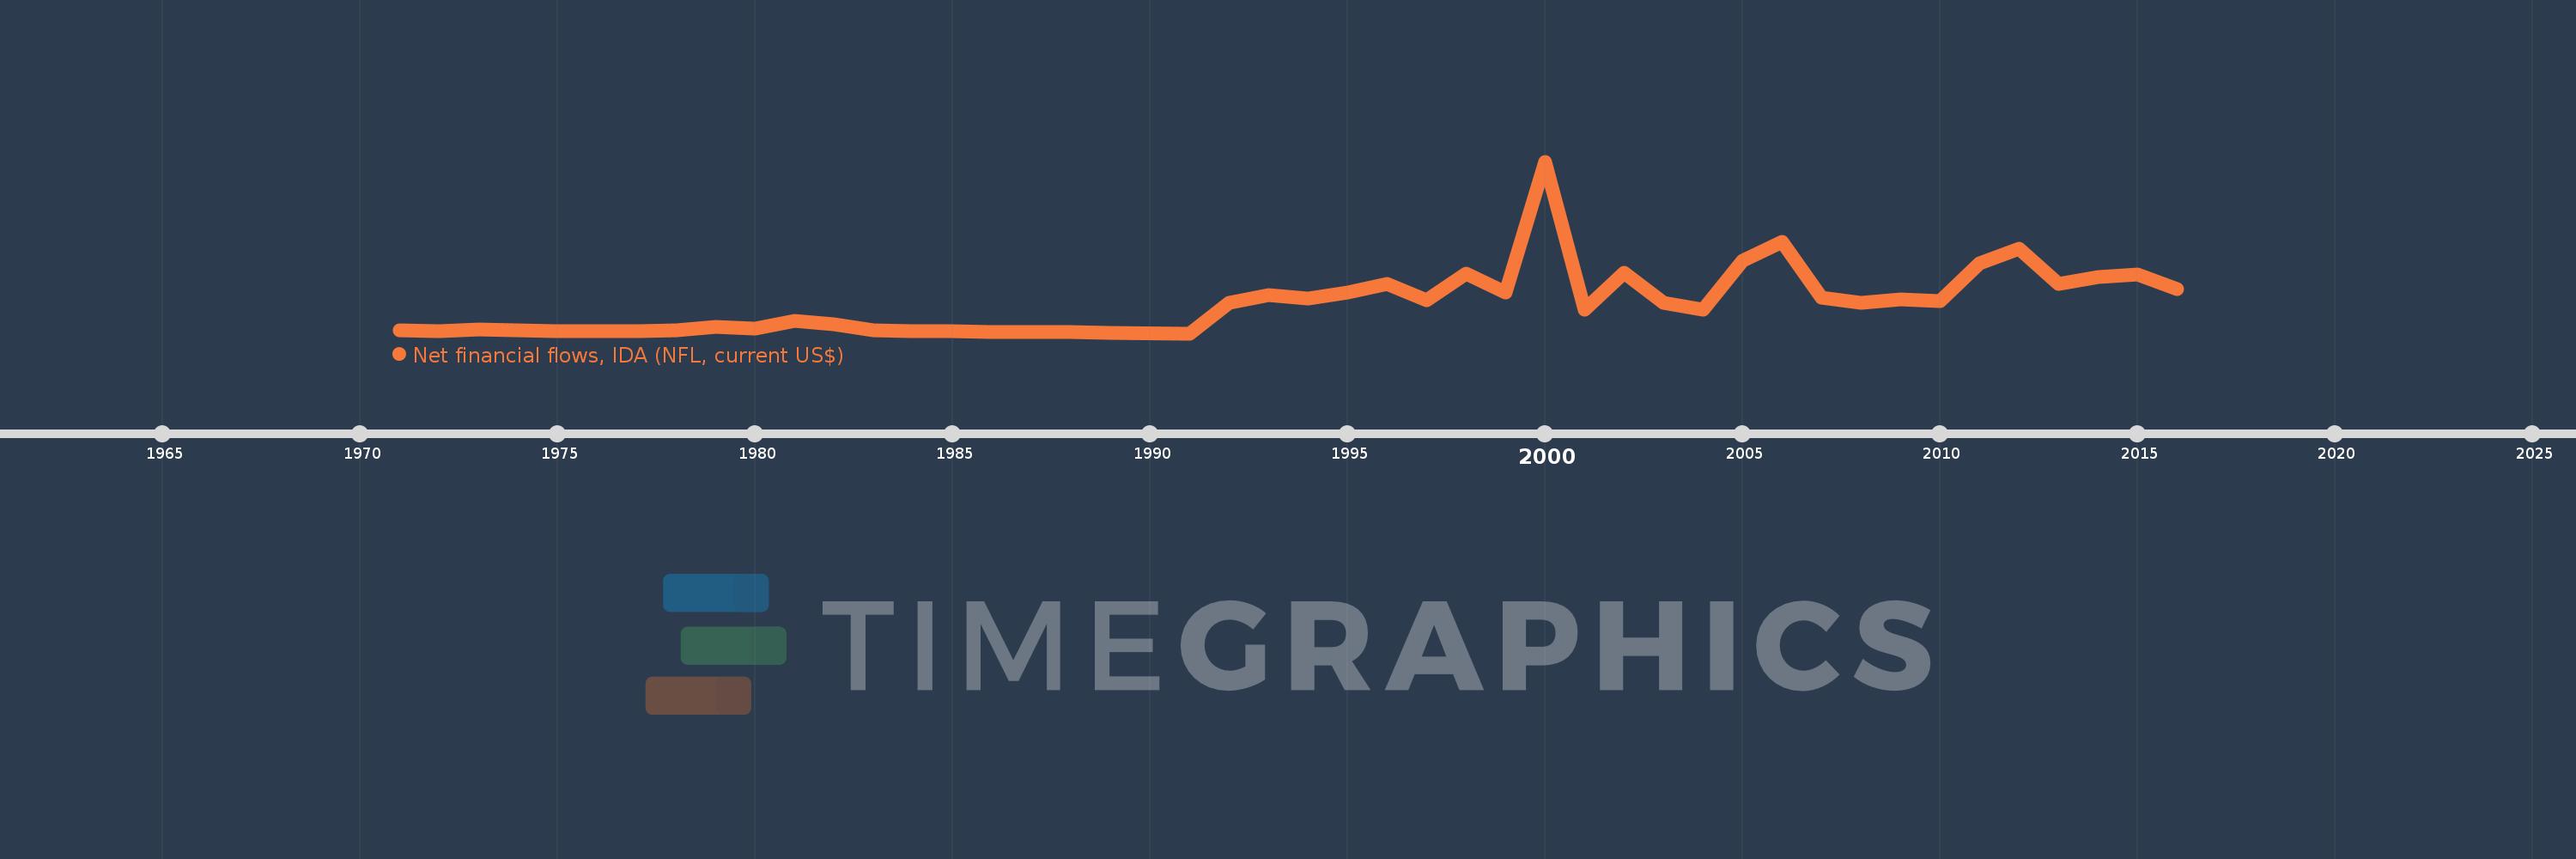
Net financial flows, IDA (NFL, current US$)
2016,2015,2014,2013,2012,2011,2010,2009,2008,2007,2006,2005,2004,2003,2002,2001,2000,1999,1998,1997,1996,1995,1994,1993,1992,1991,1989,1988,1987,1986,1985,1984,1983,1982,1981,1980,1979,1978,1977,1976,1975,1974,1973,1972,1971
This statistics in other country:
Timeline:
This timeline shows a graph from 1971 to 2016 of Honduras. No data until 1970. Number of actual observations by date: 45.
Source name:
World Development Indicators
Source organization:
World Bank, International Debt Statistics.
Categories, topics:
External Debt
Last updated:
apr 23, 2017
Indicators value changes by year
Minimum:
-2.236 mln
jan 1, 1991
Maximum:
270.865 mln
jan 1, 2000
At the date of observation
Value
Absolute change
Change from previous value
jan 1, 1971
2.052 mln
+2.052 mln
0.0%
jan 1, 1972
1.645 mln
-407.0K
-19.83%
jan 1, 1973
4.516 mln
+2.871 mln
174.53%
jan 1, 1974
2.062 mln
-2.454 mln
-54.34%
jan 1, 1975
1.149 mln
-913.0K
-44.28%
jan 1, 1976
1.741 mln
+592.0K
51.52%
jan 1, 1977
1.707 mln
-34.0K
-1.95%
jan 1, 1978
2.418 mln
+711.0K
41.65%
jan 1, 1979
8.259 mln
+5.841 mln
241.56%
jan 1, 1980
5.514 mln
-2.745 mln
-33.24%
jan 1, 1981
17.463 mln
+11.949 mln
216.7%
jan 1, 1982
12.553 mln
-4.91 mln
-28.12%
jan 1, 1983
2.724 mln
-9.829 mln
-78.3%
jan 1, 1984
1.487 mln
-1.237 mln
-45.41%
jan 1, 1985
565.0K
-922.0K
-62.0%
jan 1, 1986
65.0K
-500.0K
-88.5%
jan 1, 1987
-682.0K
-747.0K
-1.15K%
jan 1, 1988
-715.0K
-33.0K
4.84%
jan 1, 1989
-877.0K
-162.0K
22.66%
jan 1, 1991
-2.236 mln
-1.359 mln
154.96%
jan 1, 1992
46.672 mln
+48.908 mln
-2.19K%
jan 1, 1993
58.678 mln
+12.006 mln
25.72%
jan 1, 1994
53.727 mln
-4.951 mln
-8.44%
jan 1, 1995
62.072 mln
+8.345 mln
15.53%
jan 1, 1996
75.925 mln
+13.853 mln
22.32%
jan 1, 1997
50.04 mln
-25.885 mln
-34.09%
jan 1, 1998
93.13 mln
+43.09 mln
86.11%
jan 1, 1999
62.002 mln
-31.128 mln
-33.42%
jan 1, 2000
270.865 mln
+208.863 mln
336.86%
jan 1, 2001
35.931 mln
-234.934 mln
-86.73%
jan 1, 2002
94.49 mln
+58.559 mln
162.98%
jan 1, 2003
45.648 mln
-48.842 mln
-51.69%
jan 1, 2004
35.805 mln
-9.843 mln
-21.56%
jan 1, 2005
113.418 mln
+77.613 mln
216.77%
jan 1, 2006
142.901 mln
+29.483 mln
25.99%
jan 1, 2007
54.246 mln
-88.655 mln
-62.04%
jan 1, 2008
45.595 mln
-8.651 mln
-15.95%
jan 1, 2009
51.132 mln
+5.537 mln
12.14%
jan 1, 2010
49.367 mln
-1.765 mln
-3.45%
jan 1, 2011
108.669 mln
+59.302 mln
120.12%
jan 1, 2012
132.658 mln
+23.989 mln
22.08%
jan 1, 2013
76.598 mln
-56.06 mln
-42.26%
jan 1, 2014
86.797 mln
+10.199 mln
13.31%
jan 1, 2015
91.46 mln
+4.663 mln
5.37%
jan 1, 2016
68.224 mln
-23.236 mln
-25.41%
Ranking of countries by current statistics by years


Comments: