29
/
en
AIzaSyAYiBZKx7MnpbEhh9jyipgxe19OcubqV5w
April 1, 2024
25155
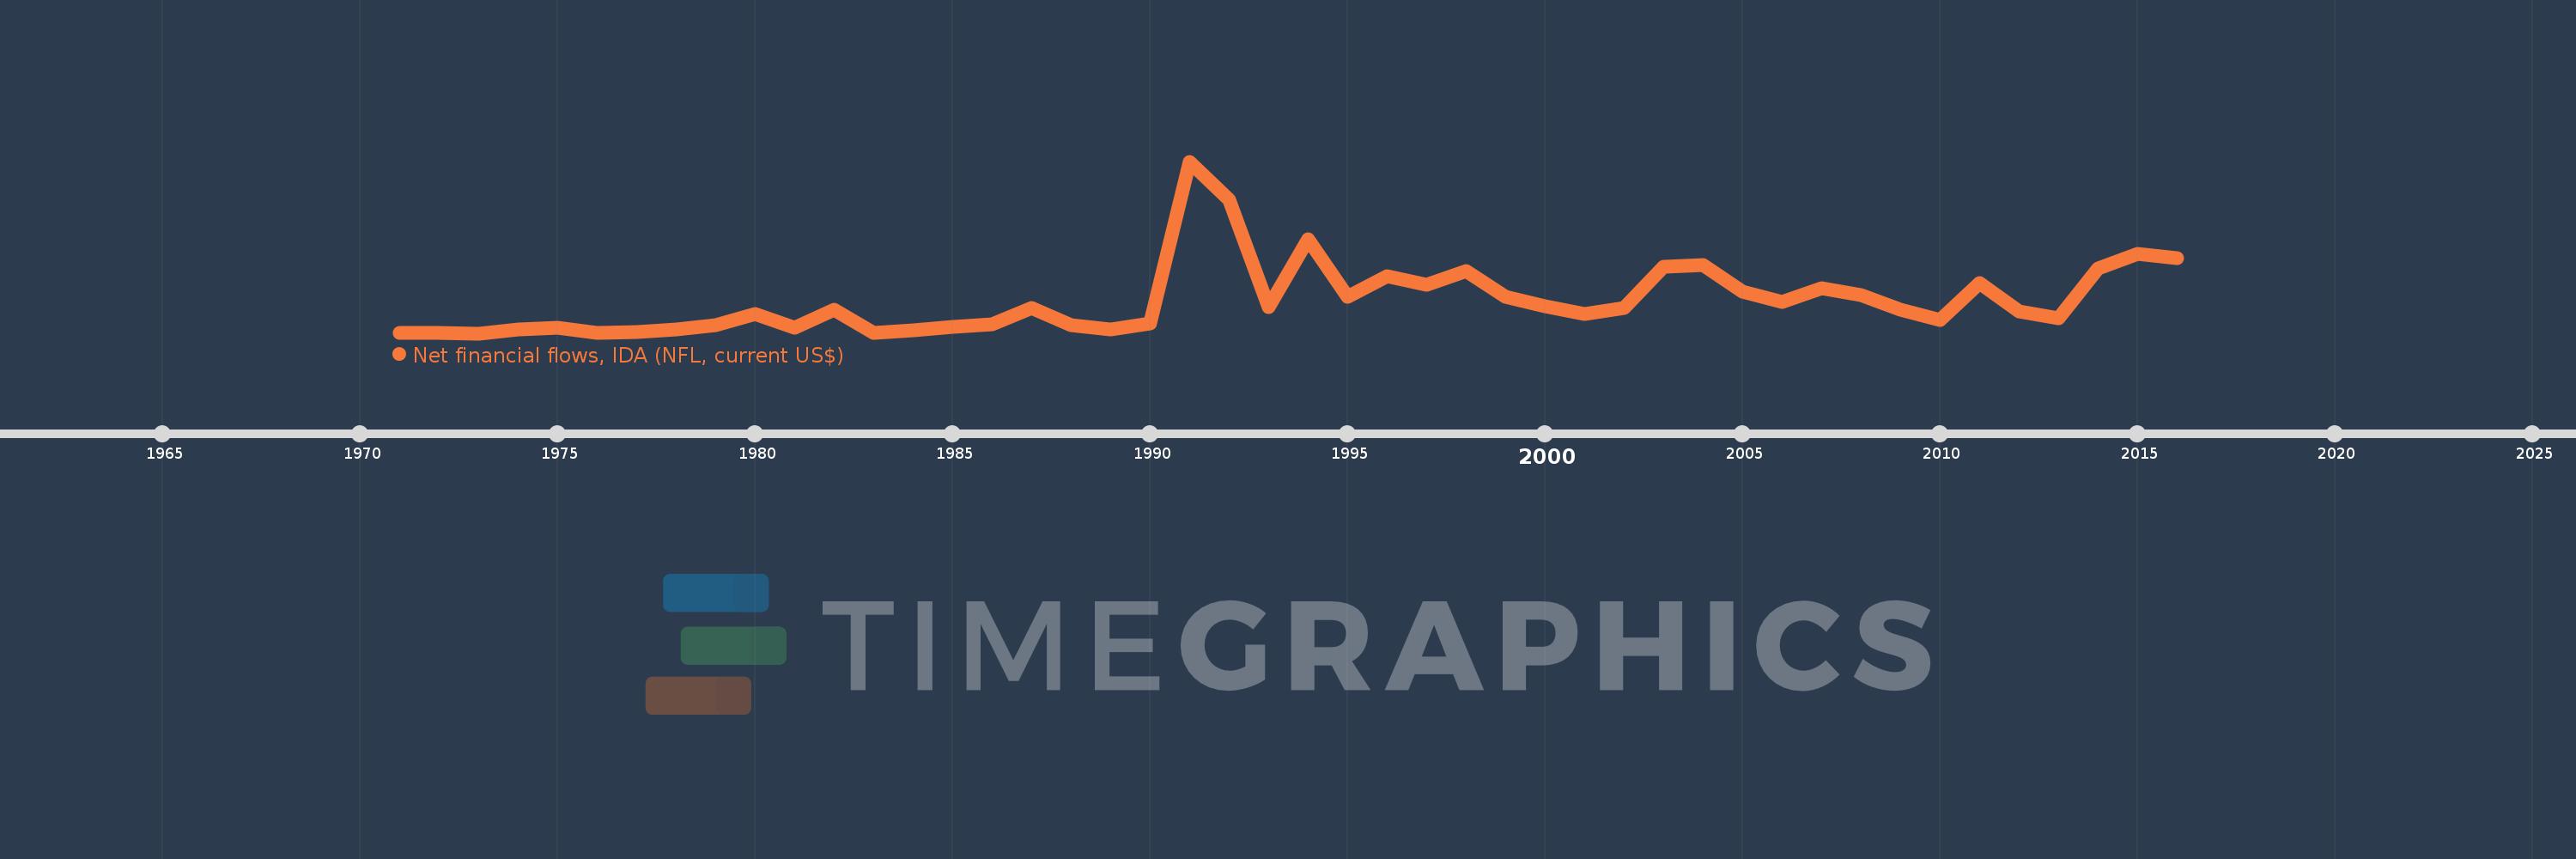
Caribbean small states
CSS
false
2
1
Net financial flows, IDA (NFL, current US$)
2016,2015,2014,2013,2012,2011,2010,2009,2008,2007,2006,2005,2004,2003,2002,2001,2000,1999,1998,1997,1996,1995,1994,1993,1992,1991,1990,1989,1988,1987,1986,1985,1984,1983,1982,1981,1980,1979,1978,1977,1976,1975,1974,1973,1972,1971
This statistics in other country:
Timeline:
This timeline shows a graph from 1971 to 2016 of Caribbean small states. No data until 1970. Number of actual observations by date: 46.
Source name:
World Development Indicators
Source organization:
World Bank, International Debt Statistics.
Categories, topics:
External Debt
Last updated:
apr 23, 2017
Indicators value changes by year
Minimum:
172.0K
jan 1, 1973
Maximum:
56.41 mln
jan 1, 1991
At the date of observation
Value
Absolute change
Change from previous value
jan 1, 1971
299.0K
+299.0K
0.0%
jan 1, 1972
176.0K
-123.0K
-41.14%
jan 1, 1973
172.0K
-4.0K
-2.27%
jan 1, 1974
1.343 mln
+1.171 mln
680.81%
jan 1, 1975
2.003 mln
+660.0K
49.14%
jan 1, 1976
372.0K
-1.631 mln
-81.43%
jan 1, 1977
537.0K
+165.0K
44.35%
jan 1, 1978
1.57 mln
+1.033 mln
192.36%
jan 1, 1979
2.933 mln
+1.363 mln
86.82%
jan 1, 1980
6.372 mln
+3.439 mln
117.25%
jan 1, 1981
2.137 mln
-4.235 mln
-66.46%
jan 1, 1982
7.787 mln
+5.65 mln
264.39%
jan 1, 1983
271.0K
-7.516 mln
-96.52%
jan 1, 1984
1.123 mln
+852.0K
314.39%
jan 1, 1985
2.341 mln
+1.218 mln
108.46%
jan 1, 1986
3.117 mln
+776.0K
33.15%
jan 1, 1987
8.369 mln
+5.252 mln
168.5%
jan 1, 1988
2.763 mln
-5.606 mln
-66.99%
jan 1, 1989
1.41 mln
-1.353 mln
-48.97%
jan 1, 1990
3.41 mln
+2.0 mln
141.84%
jan 1, 1991
56.41 mln
+53.0 mln
1.55K%
jan 1, 1992
43.909 mln
-12.501 mln
-22.16%
jan 1, 1993
8.792 mln
-35.117 mln
-79.98%
jan 1, 1994
30.866 mln
+22.074 mln
251.07%
jan 1, 1995
12.219 mln
-18.647 mln
-60.41%
jan 1, 1996
18.979 mln
+6.76 mln
55.32%
jan 1, 1997
16.141 mln
-2.838 mln
-14.95%
jan 1, 1998
20.571 mln
+4.43 mln
27.45%
jan 1, 1999
12.214 mln
-8.357 mln
-40.63%
jan 1, 2000
8.938 mln
-3.276 mln
-26.82%
jan 1, 2001
6.368 mln
-2.57 mln
-28.75%
jan 1, 2002
8.597 mln
+2.229 mln
35.0%
jan 1, 2003
22.07 mln
+13.473 mln
156.72%
jan 1, 2004
22.62 mln
+550.0K
2.49%
jan 1, 2005
13.832 mln
-8.788 mln
-38.85%
jan 1, 2006
10.301 mln
-3.531 mln
-25.53%
jan 1, 2007
15.019 mln
+4.718 mln
45.8%
jan 1, 2008
12.682 mln
-2.337 mln
-15.56%
jan 1, 2009
7.975 mln
-4.707 mln
-37.12%
jan 1, 2010
4.567 mln
-3.408 mln
-42.73%
jan 1, 2011
16.504 mln
+11.937 mln
261.38%
jan 1, 2012
7.471 mln
-9.033 mln
-54.73%
jan 1, 2013
5.113 mln
-2.358 mln
-31.56%
jan 1, 2014
21.422 mln
+16.309 mln
318.97%
jan 1, 2015
26.064 mln
+4.642 mln
21.67%
jan 1, 2016
24.877 mln
-1.187 mln
-4.55%
Ranking of countries by current statistics by years


Comments: