29
/
en
AIzaSyAYiBZKx7MnpbEhh9jyipgxe19OcubqV5w
April 1, 2024
212063
Niger
NER
true
2
1
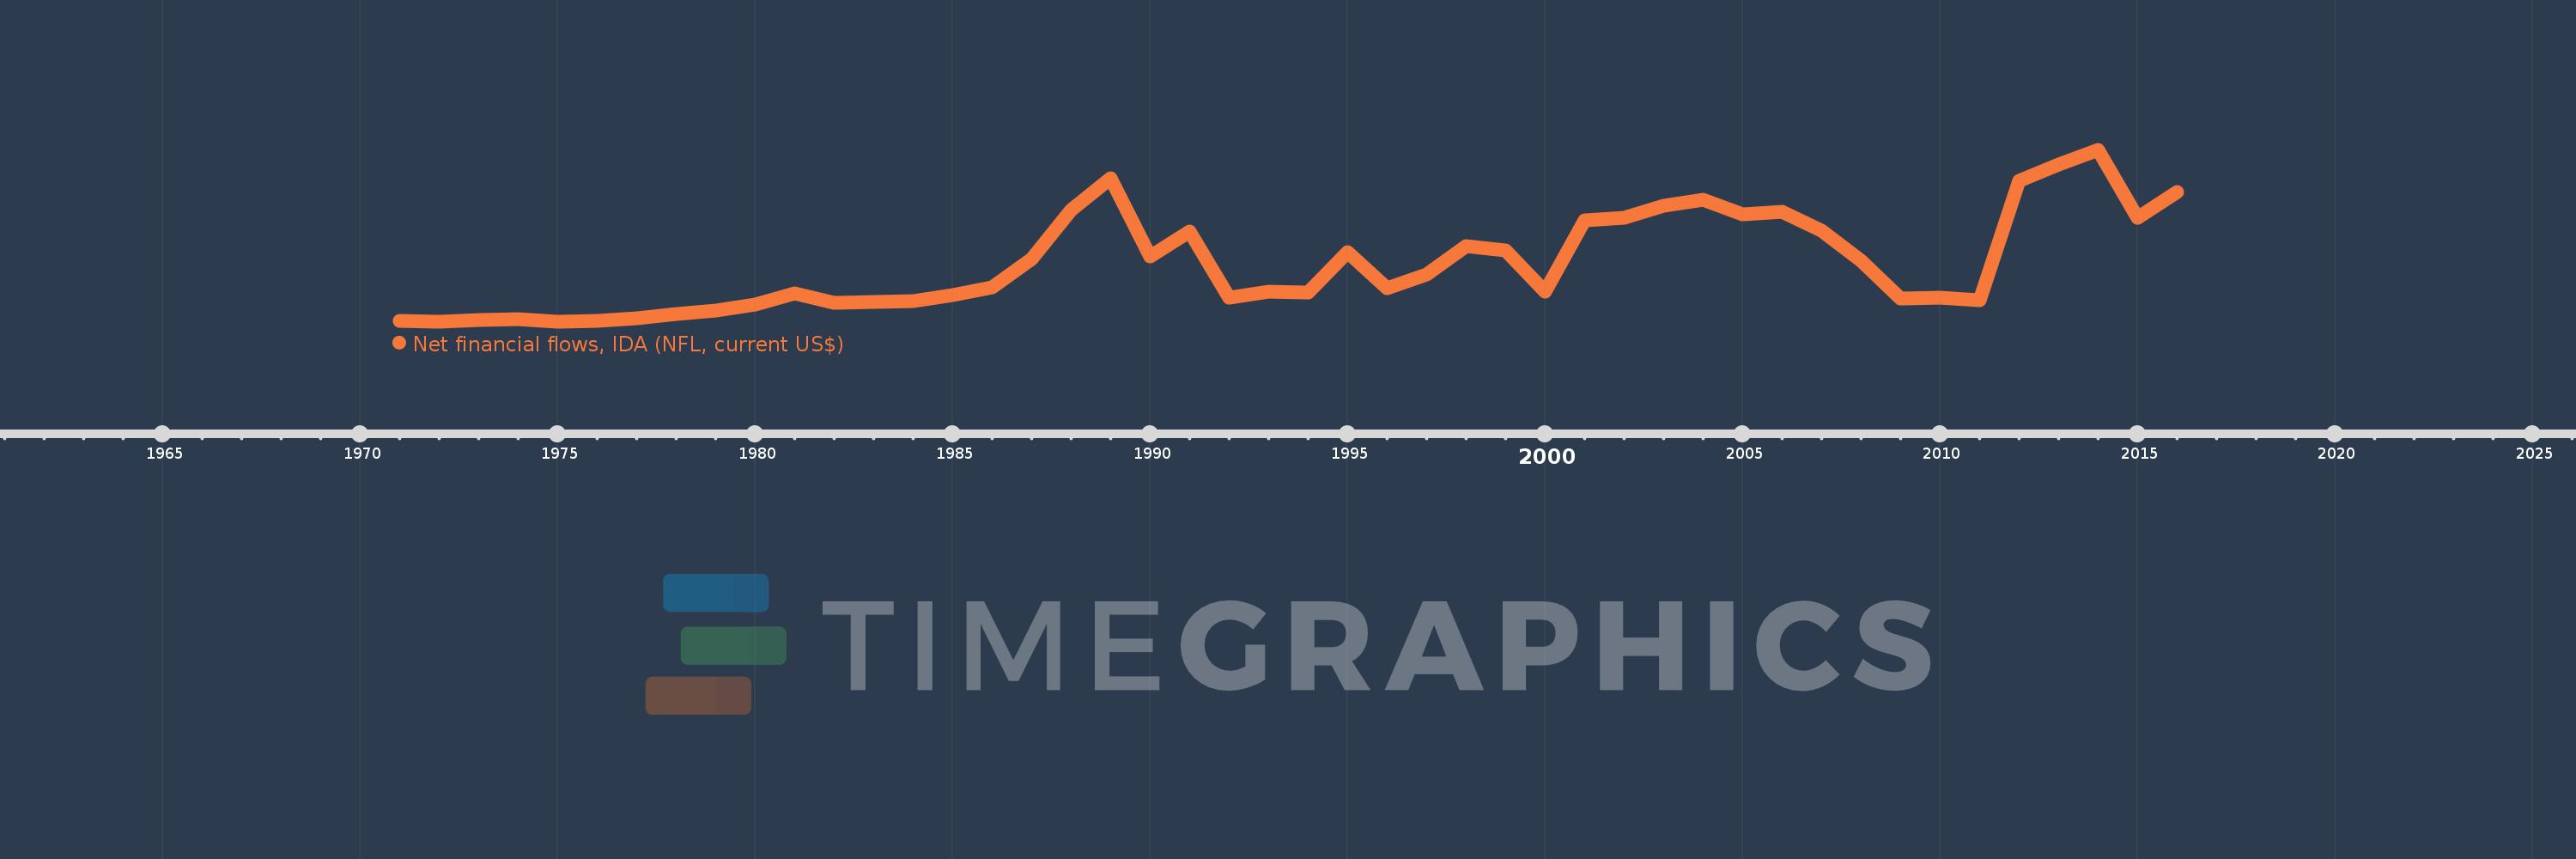
Net financial flows, IDA (NFL, current US$)
2016,2015,2014,2013,2012,2011,2010,2009,2008,2007,2006,2005,2004,2003,2002,2001,2000,1999,1998,1997,1996,1995,1994,1993,1992,1991,1990,1989,1988,1987,1986,1985,1984,1983,1982,1981,1980,1979,1978,1977,1976,1975,1974,1973,1972,1971
This statistics in other country:
Timeline:
This timeline shows a graph from 1971 to 2016 of Niger. No data until 1970. Number of actual observations by date: 46.
Source name:
World Development Indicators
Source organization:
World Bank, International Debt Statistics.
Categories, topics:
External Debt
Last updated:
apr 23, 2017
Indicators value changes by year
Minimum:
1.746 mln
jan 1, 1972
Maximum:
99.922 mln
jan 1, 2014
At the date of observation
Value
Absolute change
Change from previous value
jan 1, 1971
2.215 mln
+2.215 mln
0.0%
jan 1, 1972
1.746 mln
-469.0K
-21.17%
jan 1, 1973
3.034 mln
+1.288 mln
73.77%
jan 1, 1974
3.293 mln
+259.0K
8.54%
jan 1, 1975
1.826 mln
-1.467 mln
-44.55%
jan 1, 1976
2.315 mln
+489.0K
26.78%
jan 1, 1977
3.644 mln
+1.329 mln
57.41%
jan 1, 1978
6.184 mln
+2.54 mln
69.7%
jan 1, 1979
8.458 mln
+2.274 mln
36.77%
jan 1, 1980
11.594 mln
+3.136 mln
37.08%
jan 1, 1981
18.061 mln
+6.467 mln
55.78%
jan 1, 1982
12.465 mln
-5.596 mln
-30.98%
jan 1, 1983
13.005 mln
+540.0K
4.33%
jan 1, 1984
13.885 mln
+880.0K
6.77%
jan 1, 1985
17.131 mln
+3.246 mln
23.38%
jan 1, 1986
21.545 mln
+4.414 mln
25.77%
jan 1, 1987
37.873 mln
+16.328 mln
75.79%
jan 1, 1988
65.738 mln
+27.865 mln
73.57%
jan 1, 1989
83.825 mln
+18.087 mln
27.51%
jan 1, 1990
39.343 mln
-44.482 mln
-53.07%
jan 1, 1991
53.49 mln
+14.147 mln
35.96%
jan 1, 1992
15.846 mln
-37.644 mln
-70.38%
jan 1, 1993
19.126 mln
+3.28 mln
20.7%
jan 1, 1994
18.747 mln
-379.0K
-1.98%
jan 1, 1995
41.492 mln
+22.745 mln
121.33%
jan 1, 1996
20.887 mln
-20.605 mln
-49.66%
jan 1, 1997
28.721 mln
+7.834 mln
37.51%
jan 1, 1998
44.879 mln
+16.158 mln
56.26%
jan 1, 1999
42.816 mln
-2.063 mln
-4.6%
jan 1, 2000
19.301 mln
-23.515 mln
-54.92%
jan 1, 2001
59.809 mln
+40.508 mln
209.88%
jan 1, 2002
61.53 mln
+1.721 mln
2.88%
jan 1, 2003
68.276 mln
+6.746 mln
10.96%
jan 1, 2004
71.839 mln
+3.563 mln
5.22%
jan 1, 2005
63.178 mln
-8.661 mln
-12.06%
jan 1, 2006
64.582 mln
+1.404 mln
2.22%
jan 1, 2007
54.164 mln
-10.418 mln
-16.13%
jan 1, 2008
36.643 mln
-17.521 mln
-32.35%
jan 1, 2009
15.009 mln
-21.634 mln
-59.04%
jan 1, 2010
15.8 mln
+791.0K
5.27%
jan 1, 2011
14.097 mln
-1.703 mln
-10.78%
jan 1, 2012
82.277 mln
+68.18 mln
483.65%
jan 1, 2013
91.811 mln
+9.534 mln
11.59%
jan 1, 2014
99.922 mln
+8.111 mln
8.83%
jan 1, 2015
61.137 mln
-38.785 mln
-38.82%
jan 1, 2016
75.997 mln
+14.86 mln
24.31%
Ranking of countries by current statistics by years


Comments: