29
/
en
AIzaSyAYiBZKx7MnpbEhh9jyipgxe19OcubqV5w
April 1, 2024
185553
Madagascar
MDG
true
2
1
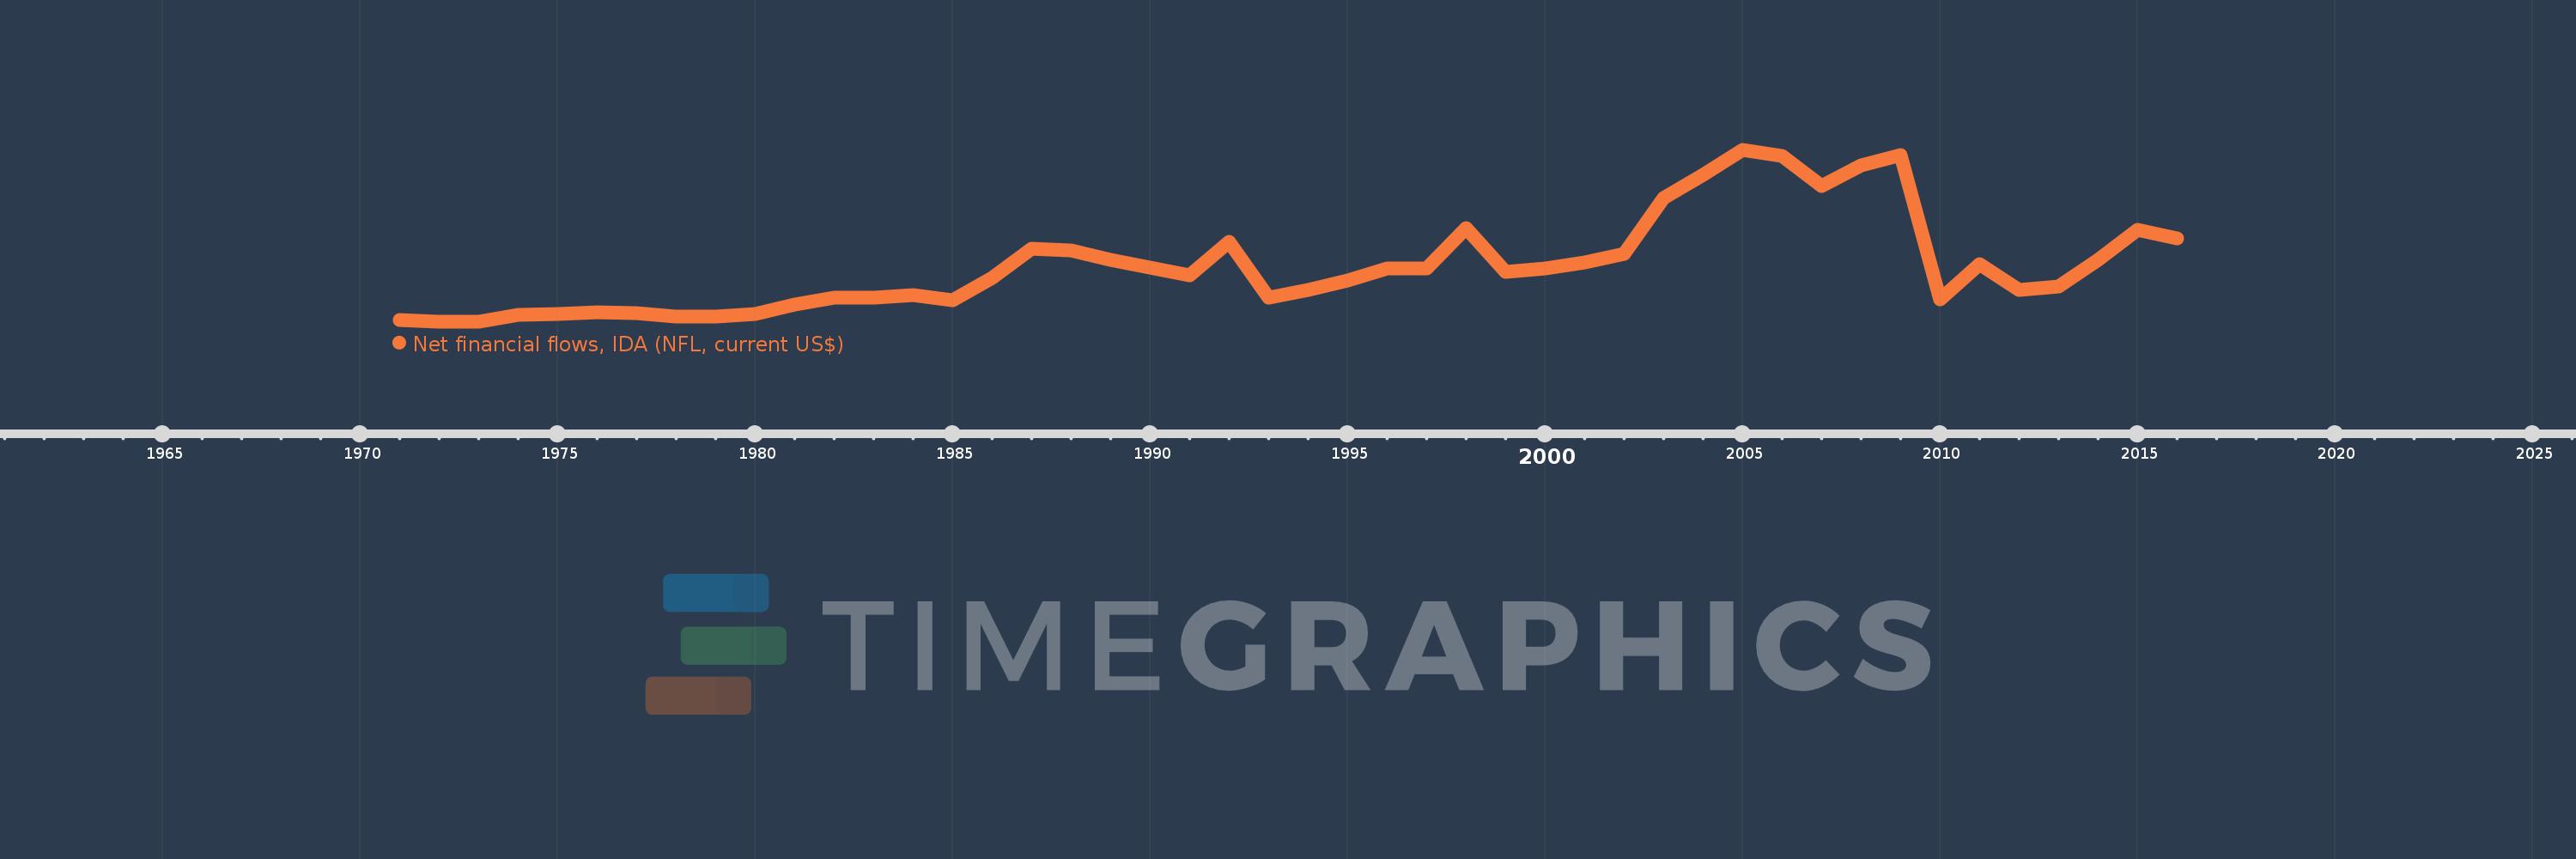
Net financial flows, IDA (NFL, current US$)
2016,2015,2014,2013,2012,2011,2010,2009,2008,2007,2006,2005,2004,2003,2002,2001,2000,1999,1998,1997,1996,1995,1994,1993,1992,1991,1990,1989,1988,1987,1986,1985,1984,1983,1982,1981,1980,1979,1978,1977,1976,1975,1974,1973,1972,1971
This statistics in other country:
Timeline:
This timeline shows a graph from 1971 to 2016 of Madagascar. No data until 1970. Number of actual observations by date: 46.
Source name:
World Development Indicators
Source organization:
World Bank, International Debt Statistics.
Categories, topics:
External Debt
Last updated:
apr 23, 2017
Indicators value changes by year
Minimum:
2.219 mln
jan 1, 1973
Maximum:
216.743 mln
jan 1, 2005
At the date of observation
Value
Absolute change
Change from previous value
jan 1, 1971
5.018 mln
+5.018 mln
0.0%
jan 1, 1972
2.297 mln
-2.721 mln
-54.22%
jan 1, 1973
2.219 mln
-78.0K
-3.4%
jan 1, 1974
10.604 mln
+8.385 mln
377.87%
jan 1, 1975
12.126 mln
+1.522 mln
14.35%
jan 1, 1976
14.097 mln
+1.971 mln
16.25%
jan 1, 1977
13.55 mln
-547.0K
-3.88%
jan 1, 1978
8.758 mln
-4.792 mln
-35.37%
jan 1, 1979
8.492 mln
-266.0K
-3.04%
jan 1, 1980
12.41 mln
+3.918 mln
46.14%
jan 1, 1981
24.524 mln
+12.114 mln
97.61%
jan 1, 1982
32.615 mln
+8.091 mln
32.99%
jan 1, 1983
32.888 mln
+273.0K
0.84%
jan 1, 1984
36.314 mln
+3.426 mln
10.42%
jan 1, 1985
29.489 mln
-6.825 mln
-18.79%
jan 1, 1986
57.072 mln
+27.583 mln
93.54%
jan 1, 1987
93.443 mln
+36.371 mln
63.73%
jan 1, 1988
91.035 mln
-2.408 mln
-2.58%
jan 1, 1989
79.255 mln
-11.78 mln
-12.94%
jan 1, 1990
70.296 mln
-8.959 mln
-11.3%
jan 1, 1991
60.739 mln
-9.557 mln
-13.6%
jan 1, 1992
102.645 mln
+41.906 mln
68.99%
jan 1, 1993
32.987 mln
-69.658 mln
-67.86%
jan 1, 1994
42.056 mln
+9.069 mln
27.49%
jan 1, 1995
53.573 mln
+11.517 mln
27.38%
jan 1, 1996
69.269 mln
+15.696 mln
29.3%
jan 1, 1997
68.558 mln
-711.0K
-1.03%
jan 1, 1998
119.669 mln
+51.111 mln
74.55%
jan 1, 1999
64.53 mln
-55.139 mln
-46.08%
jan 1, 2000
68.569 mln
+4.039 mln
6.26%
jan 1, 2001
76.857 mln
+8.288 mln
12.09%
jan 1, 2002
86.843 mln
+9.986 mln
12.99%
jan 1, 2003
157.313 mln
+70.47 mln
81.15%
jan 1, 2004
185.999 mln
+28.686 mln
18.23%
jan 1, 2005
216.743 mln
+30.744 mln
16.53%
jan 1, 2006
209.186 mln
-7.557 mln
-3.49%
jan 1, 2007
171.688 mln
-37.498 mln
-17.93%
jan 1, 2008
198.096 mln
+26.408 mln
15.38%
jan 1, 2009
210.173 mln
+12.077 mln
6.1%
jan 1, 2010
30.361 mln
-179.812 mln
-85.55%
jan 1, 2011
74.561 mln
+44.2 mln
145.58%
jan 1, 2012
41.725 mln
-32.836 mln
-44.04%
jan 1, 2013
46.812 mln
+5.087 mln
12.19%
jan 1, 2014
80.191 mln
+33.379 mln
71.3%
jan 1, 2015
117.811 mln
+37.62 mln
46.91%
jan 1, 2016
106.517 mln
-11.294 mln
-9.59%
Ranking of countries by current statistics by years


Comments: