29
/
en
AIzaSyAYiBZKx7MnpbEhh9jyipgxe19OcubqV5w
April 1, 2024
40936
Late-demographic dividend
LTE
false
2
1
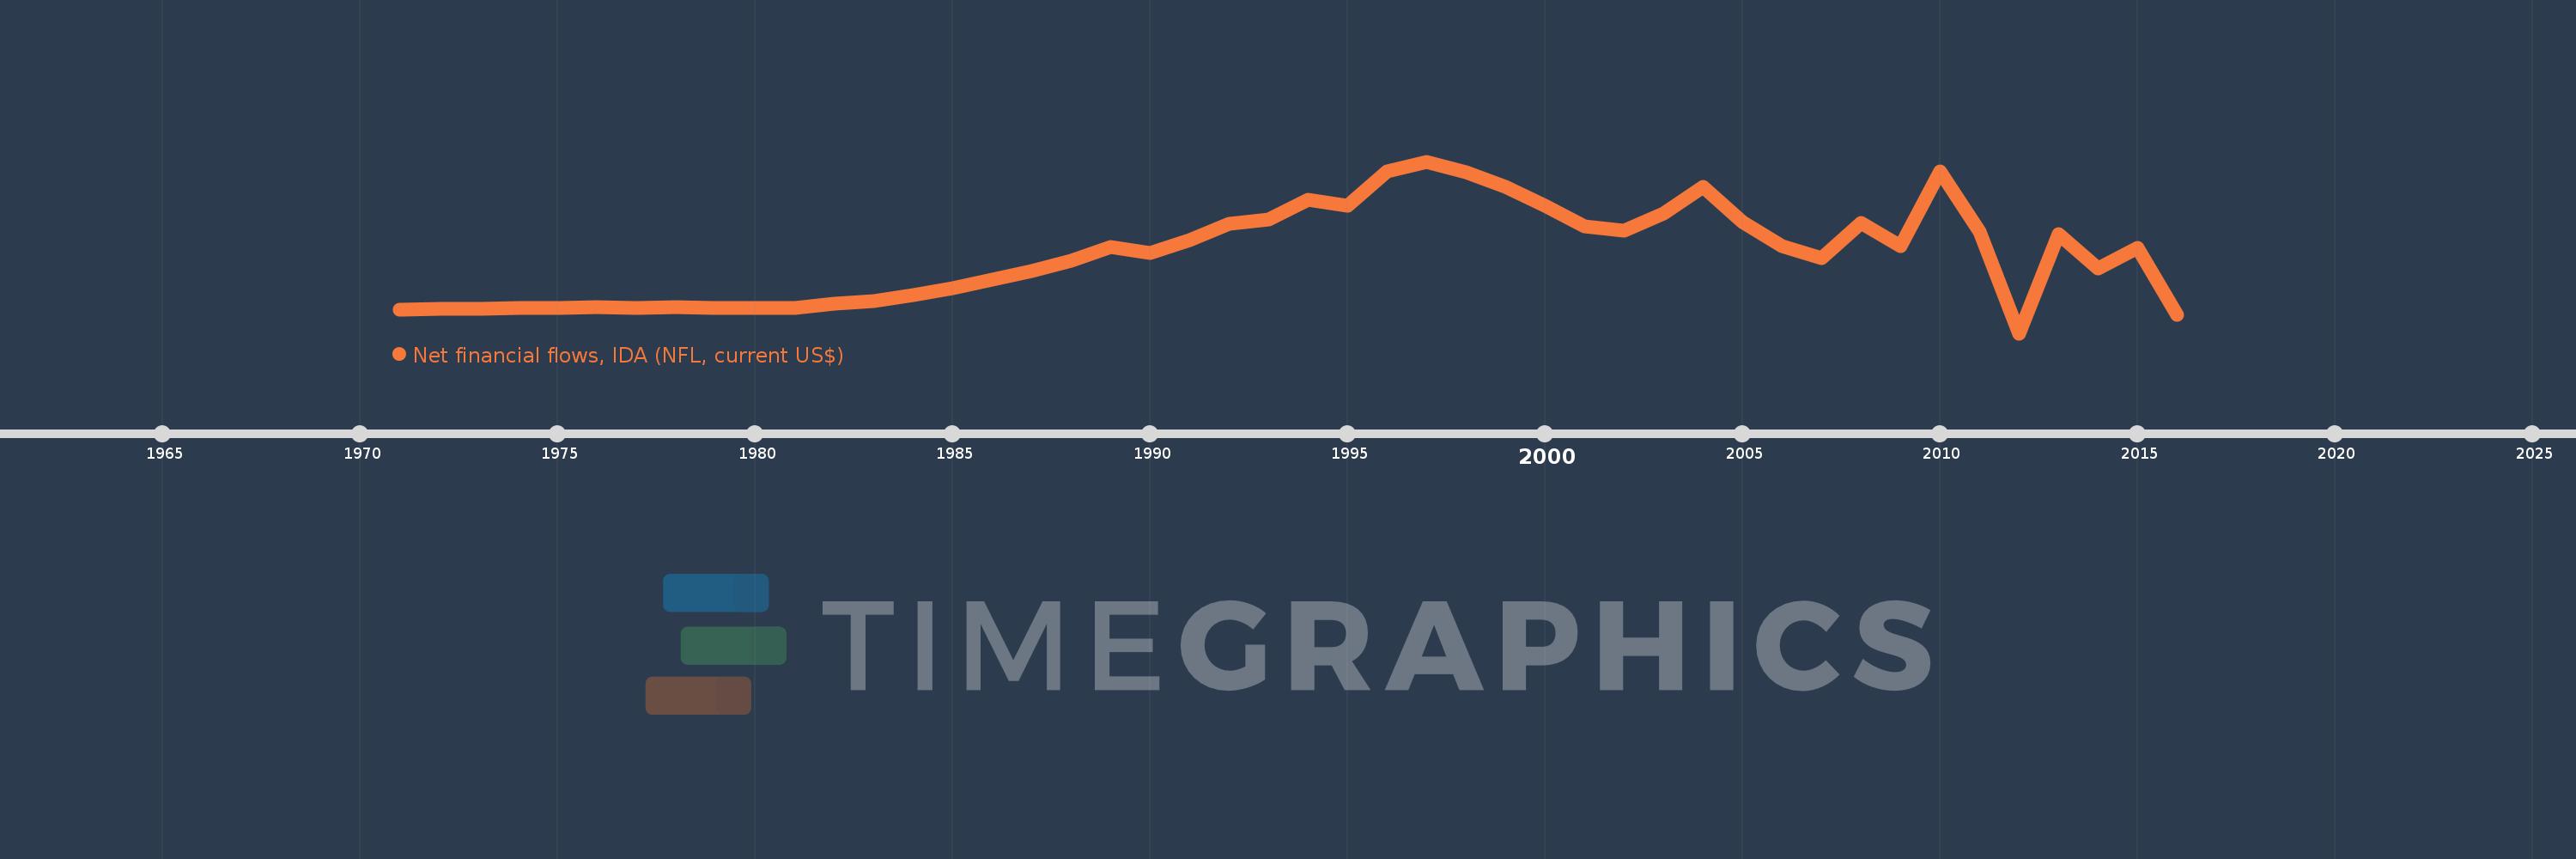
Net financial flows, IDA (NFL, current US$)
2016,2015,2014,2013,2012,2011,2010,2009,2008,2007,2006,2005,2004,2003,2002,2001,2000,1999,1998,1997,1996,1995,1994,1993,1992,1991,1990,1989,1988,1987,1986,1985,1984,1983,1982,1981,1980,1979,1978,1977,1976,1975,1974,1973,1972,1971
This statistics in other country:
Timeline:
This timeline shows a graph from 1971 to 2016 of Late-demographic dividend. No data until 1970. Number of actual observations by date: 46.
Source name:
World Development Indicators
Source organization:
World Bank, International Debt Statistics.
Categories, topics:
External Debt
Last updated:
apr 23, 2017
Indicators value changes by year
Minimum:
-217.092 mln
jan 1, 2012
Maximum:
1.431 bln
jan 1, 1997
At the date of observation
Value
Absolute change
Change from previous value
jan 1, 1971
5.915 mln
+5.915 mln
0.0%
jan 1, 1972
14.736 mln
+8.821 mln
149.13%
jan 1, 1973
19.482 mln
+4.746 mln
32.21%
jan 1, 1974
22.952 mln
+3.47 mln
17.81%
jan 1, 1975
28.625 mln
+5.673 mln
24.72%
jan 1, 1976
33.022 mln
+4.397 mln
15.36%
jan 1, 1977
27.924 mln
-5.098 mln
-15.44%
jan 1, 1978
30.9 mln
+2.976 mln
10.66%
jan 1, 1979
23.33 mln
-7.57 mln
-24.5%
jan 1, 1980
23.567 mln
+237.0K
1.02%
jan 1, 1981
29.412 mln
+5.845 mln
24.8%
jan 1, 1982
71.12 mln
+41.708 mln
141.81%
jan 1, 1983
89.203 mln
+18.083 mln
25.43%
jan 1, 1984
152.265 mln
+63.062 mln
70.69%
jan 1, 1985
215.294 mln
+63.029 mln
41.39%
jan 1, 1986
300.04 mln
+84.746 mln
39.36%
jan 1, 1987
378.91 mln
+78.87 mln
26.29%
jan 1, 1988
481.753 mln
+102.843 mln
27.14%
jan 1, 1989
609.984 mln
+128.231 mln
26.62%
jan 1, 1990
554.978 mln
-55.006 mln
-9.02%
jan 1, 1991
680.023 mln
+125.045 mln
22.53%
jan 1, 1992
829.648 mln
+149.625 mln
22.0%
jan 1, 1993
876.416 mln
+46.768 mln
5.64%
jan 1, 1994
1.064 bln
+187.6 mln
21.41%
jan 1, 1995
1.007 bln
-57.193 mln
-5.38%
jan 1, 1996
1.334 bln
+327.041 mln
32.48%
jan 1, 1997
1.431 bln
+96.723 mln
7.25%
jan 1, 1998
1.327 bln
-103.737 mln
-7.25%
jan 1, 1999
1.187 bln
-140.257 mln
-10.57%
jan 1, 2000
1.002 bln
-184.278 mln
-15.53%
jan 1, 2001
810.251 mln
-192.064 mln
-19.16%
jan 1, 2002
770.828 mln
-39.423 mln
-4.87%
jan 1, 2003
928.429 mln
+157.601 mln
20.45%
jan 1, 2004
1.188 bln
+259.393 mln
27.94%
jan 1, 2005
847.46 mln
-340.362 mln
-28.65%
jan 1, 2006
617.079 mln
-230.381 mln
-27.18%
jan 1, 2007
507.609 mln
-109.47 mln
-17.74%
jan 1, 2008
841.572 mln
+333.963 mln
65.79%
jan 1, 2009
618.123 mln
-223.449 mln
-26.55%
jan 1, 2010
1.336 bln
+717.864 mln
116.14%
jan 1, 2011
756.214 mln
-579.773 mln
-43.4%
jan 1, 2012
-217.092 mln
-973.306 mln
-128.71%
jan 1, 2013
732.607 mln
+949.699 mln
-437.46%
jan 1, 2014
402.908 mln
-329.699 mln
-45.0%
jan 1, 2015
603.804 mln
+200.896 mln
49.86%
jan 1, 2016
-36.574 mln
-640.378 mln
-106.06%
Ranking of countries by current statistics by years


Comments: