29
/
en
AIzaSyAYiBZKx7MnpbEhh9jyipgxe19OcubqV5w
April 1, 2024
106324
China
CHN
true
2
1
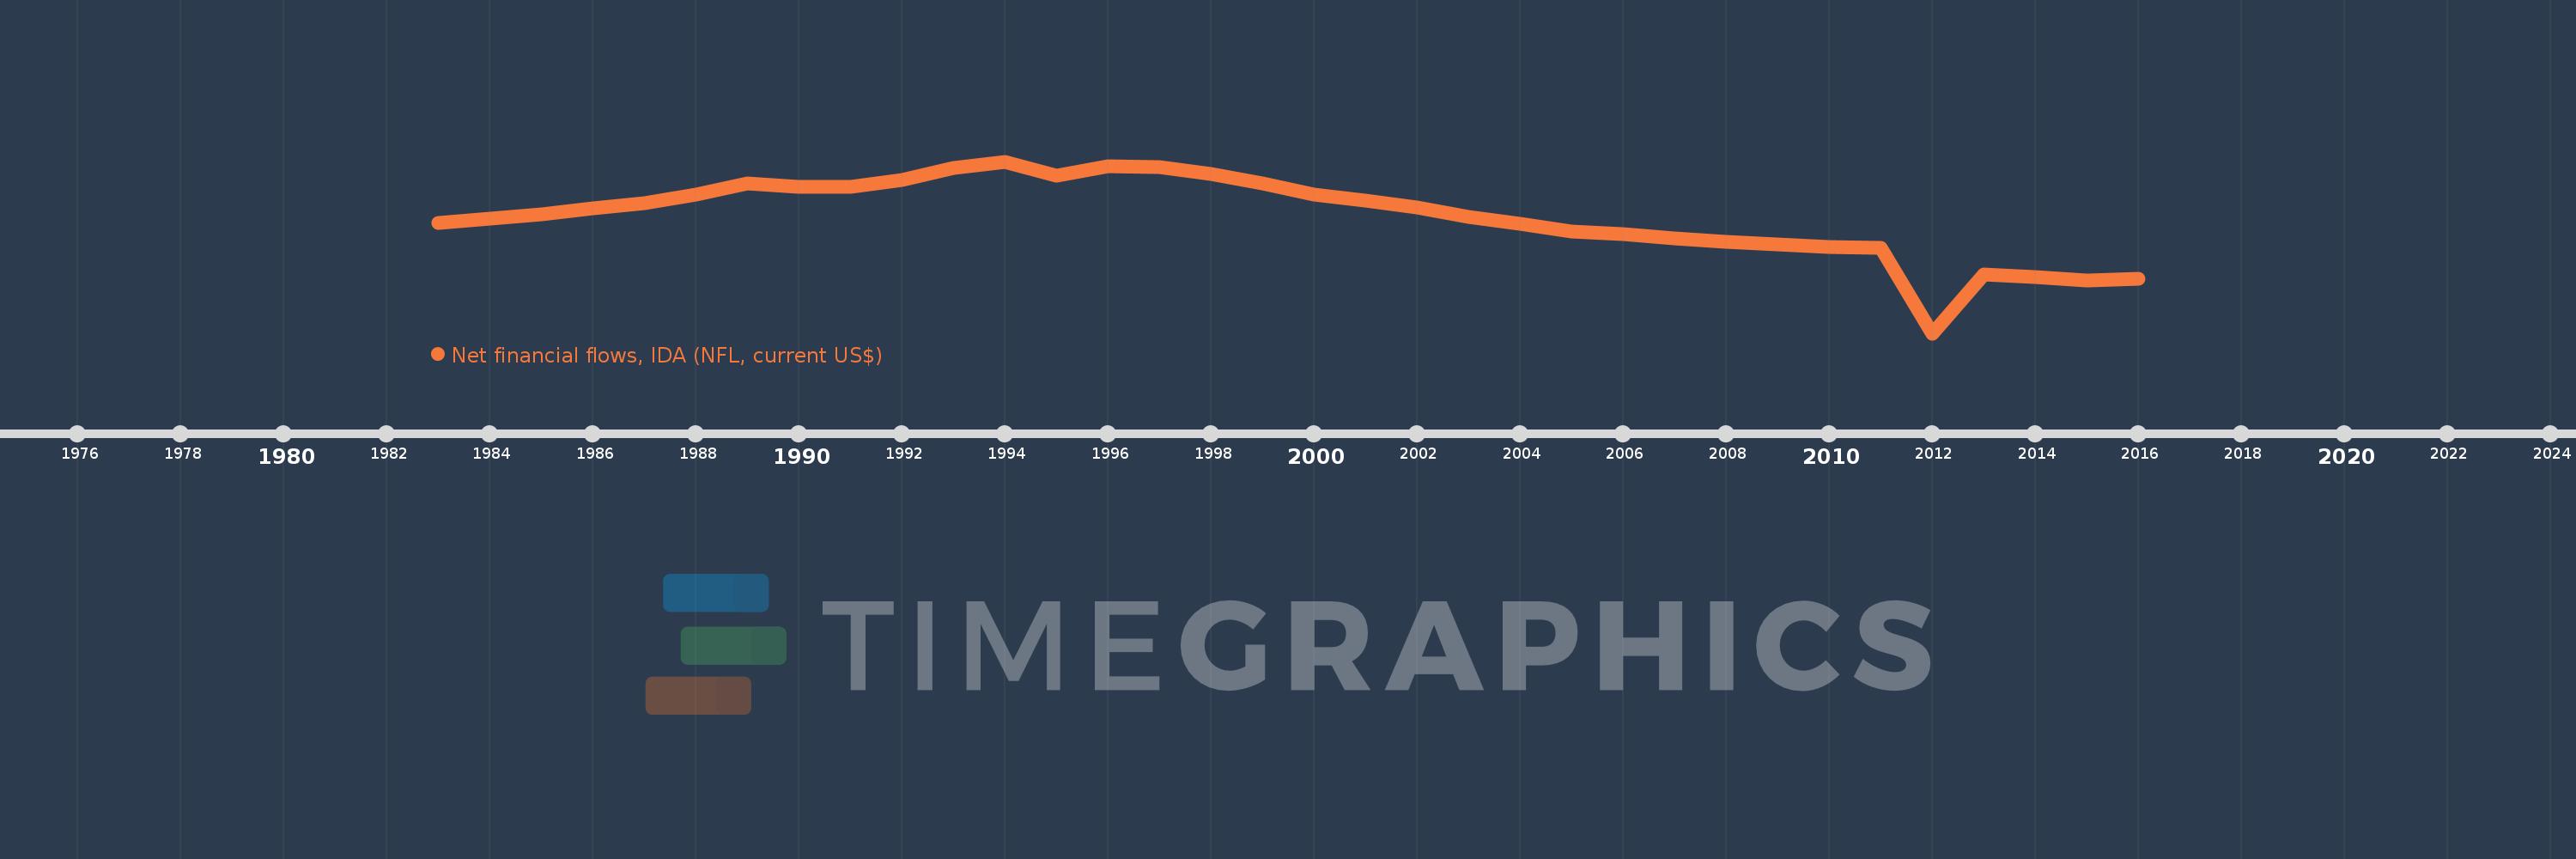
Net financial flows, IDA (NFL, current US$)
2016,2015,2014,2013,2012,2011,2010,2009,2008,2007,2006,2005,2004,2003,2002,2001,2000,1999,1998,1997,1996,1995,1994,1993,1992,1991,1990,1989,1988,1987,1986,1985,1984,1983
This statistics in other country:
Timeline:
This timeline shows a graph from 1983 to 2016 of China. No data until 1982. Number of actual observations by date: 34.
Source name:
World Development Indicators
Source organization:
World Bank, International Debt Statistics.
Categories, topics:
External Debt
Last updated:
apr 23, 2017
Indicators value changes by year
Minimum:
-1.539 bln
jan 1, 2012
Maximum:
865.116 mln
jan 1, 1994
At the date of observation
Value
Absolute change
Change from previous value
jan 1, 1983
883.0K
+883.0K
0.0%
jan 1, 1984
67.4 mln
+66.517 mln
7.53K%
jan 1, 1985
123.57 mln
+56.17 mln
83.34%
jan 1, 1986
211.786 mln
+88.216 mln
71.39%
jan 1, 1987
282.263 mln
+70.477 mln
33.28%
jan 1, 1988
399.245 mln
+116.982 mln
41.44%
jan 1, 1989
557.101 mln
+157.856 mln
39.54%
jan 1, 1990
507.021 mln
-50.08 mln
-8.99%
jan 1, 1991
506.898 mln
-123.0K
-0.02%
jan 1, 1992
611.301 mln
+104.403 mln
20.6%
jan 1, 1993
776.766 mln
+165.465 mln
27.07%
jan 1, 1994
865.116 mln
+88.35 mln
11.37%
jan 1, 1995
670.963 mln
-194.153 mln
-22.44%
jan 1, 1996
798.175 mln
+127.212 mln
18.96%
jan 1, 1997
790.601 mln
-7.574 mln
-0.95%
jan 1, 1998
687.063 mln
-103.538 mln
-13.1%
jan 1, 1999
553.788 mln
-133.275 mln
-19.4%
jan 1, 2000
406.807 mln
-146.981 mln
-26.54%
jan 1, 2001
313.626 mln
-93.181 mln
-22.91%
jan 1, 2002
223.665 mln
-89.961 mln
-28.68%
jan 1, 2003
94.747 mln
-128.918 mln
-57.64%
jan 1, 2004
-6.329 mln
-101.076 mln
-106.68%
jan 1, 2005
-116.729 mln
-110.4 mln
1.74K%
jan 1, 2006
-146.708 mln
-29.979 mln
25.68%
jan 1, 2007
-208.215 mln
-61.507 mln
41.92%
jan 1, 2008
-261.282 mln
-53.067 mln
25.49%
jan 1, 2009
-299.83 mln
-38.548 mln
14.75%
jan 1, 2010
-329.765 mln
-29.935 mln
9.98%
jan 1, 2011
-348.368 mln
-18.603 mln
5.64%
jan 1, 2012
-1.539 bln
-1.191 bln
341.87%
jan 1, 2013
-717.525 mln
+821.808 mln
-53.39%
jan 1, 2014
-756.849 mln
-39.324 mln
5.48%
jan 1, 2015
-799.453 mln
-42.604 mln
5.63%
jan 1, 2016
-778.022 mln
+21.431 mln
-2.68%
Ranking of countries by current statistics by years


Comments: