29
/
en
AIzaSyAYiBZKx7MnpbEhh9jyipgxe19OcubqV5w
April 1, 2024
72949
Australia
AUS
true
2
1
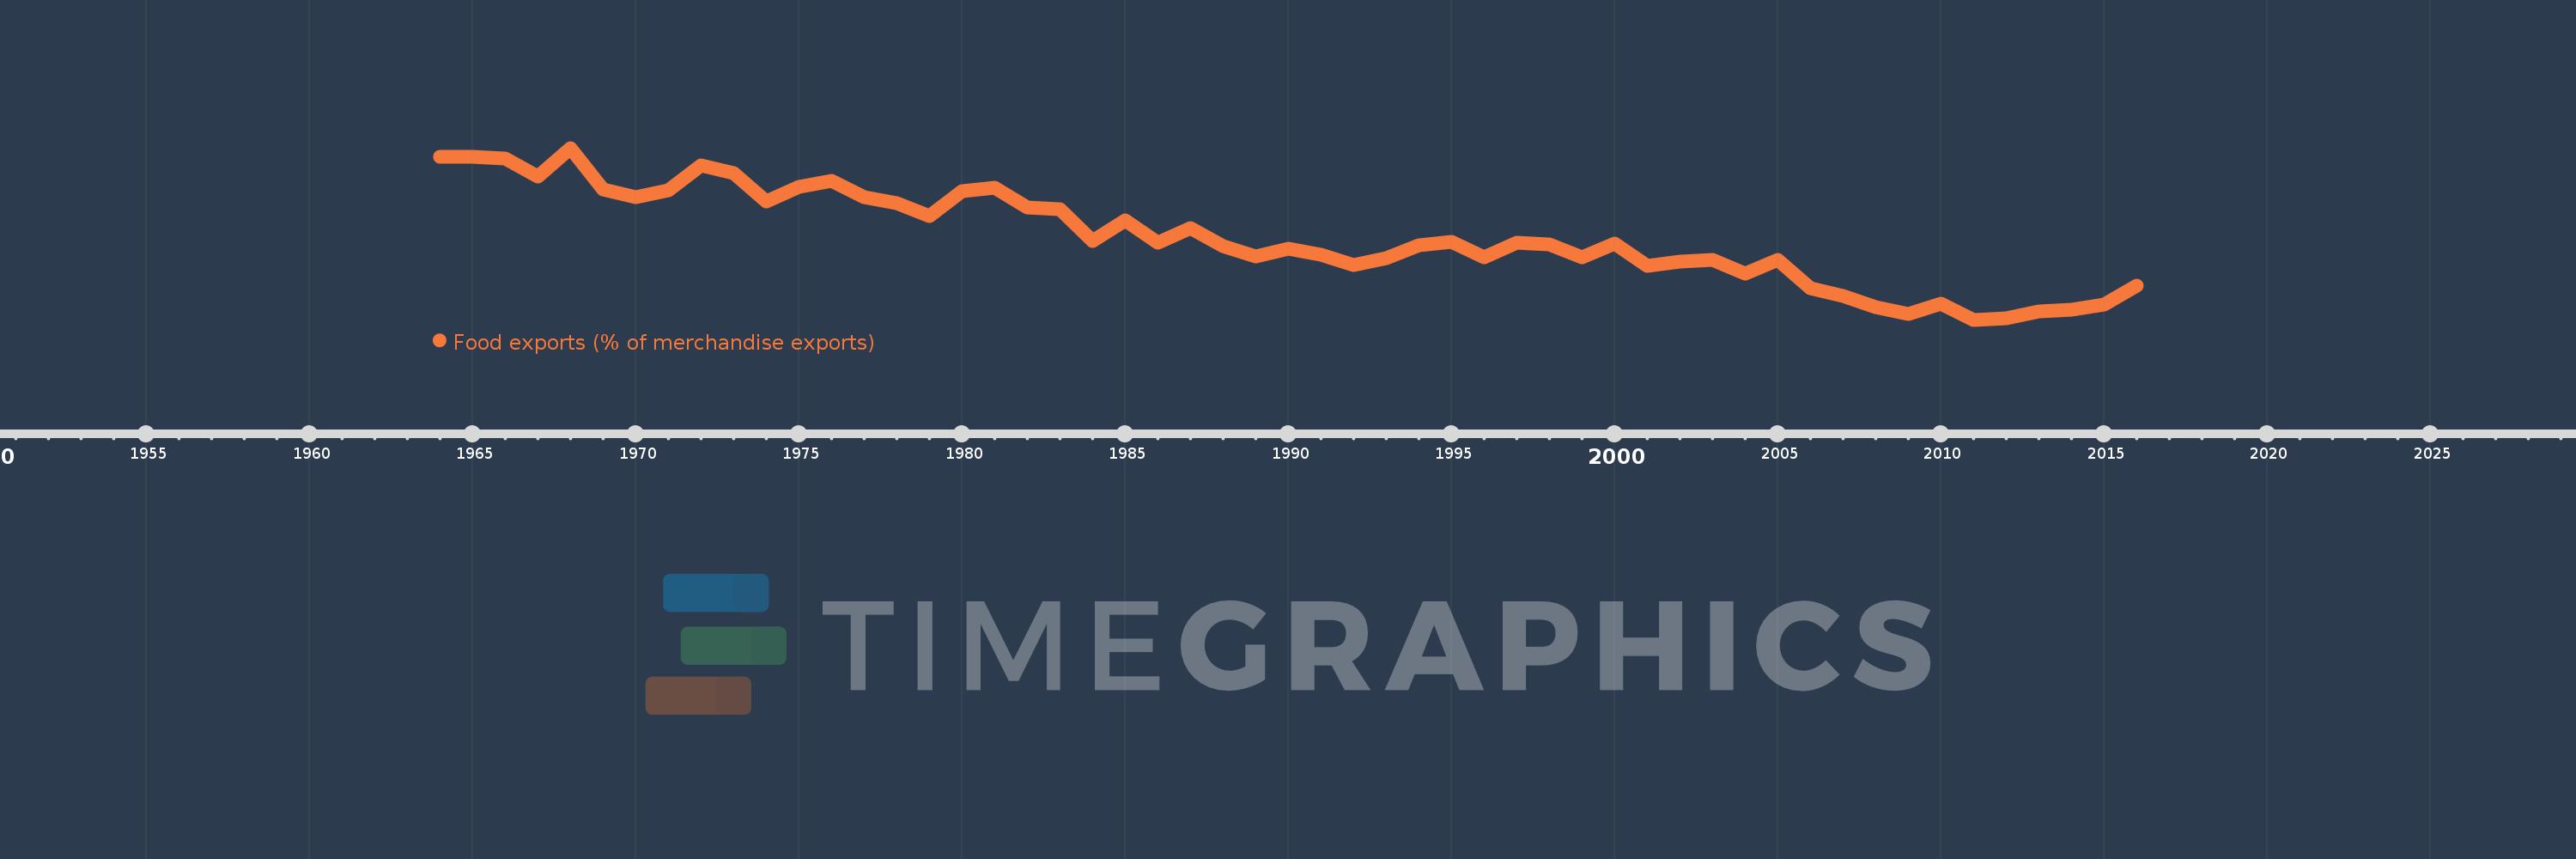
Food exports (% of merchandise exports)
2016,2015,2014,2013,2012,2011,2010,2009,2008,2007,2006,2005,2004,2003,2002,2001,2000,1999,1998,1997,1996,1995,1994,1993,1992,1991,1990,1989,1988,1987,1986,1985,1984,1983,1982,1981,1980,1979,1978,1977,1976,1975,1974,1973,1972,1971,1970,1969,1968,1967,1966,1965,1964
This statistics in other country:
AfghanistanAlbaniaAlgeriaAndorraAngolaAntigua and BarbudaArab WorldArgentinaArmeniaArubaAustraliaAustriaAzerbaijanBahamas, TheBahrainBangladeshBarbadosBelarusBelgiumBelizeBeninBermudaBhutanBoliviaBosnia and HerzegovinaBotswanaBrazilBrunei DarussalamBulgariaBurkina FasoBurundiCabo VerdeCambodiaCameroonCanadaCaribbean small statesCayman IslandsCentral African RepublicCentral Europe and the BalticsChadChileChinaColombiaComorosCongo, Dem. Rep.Congo, Rep.Costa RicaCote d'IvoireCroatiaCubaCyprusCzech RepublicDenmarkDjiboutiDominicaDominican RepublicEarly-demographic dividendEast Asia & PacificEast Asia & Pacific (excluding high income)East Asia & Pacific (IDA & IBRD countries)EcuadorEgypt, Arab Rep.El SalvadorEquatorial GuineaEritreaEstoniaEthiopiaEuro areaEurope & Central AsiaEurope & Central Asia (excluding high income)Europe & Central Asia (IDA & IBRD countries)European UnionFaroe IslandsFijiFinlandFragile and conflict affected situationsFranceFrench PolynesiaGabonGambia, TheGeorgiaGermanyGhanaGreeceGreenlandGrenadaGuatemalaGuineaGuinea-BissauGuyanaHaitiHeavily indebted poor countries (HIPC)High incomeHondurasHong Kong SAR, ChinaHungaryIBRD onlyIcelandIDA & IBRD totalIDA blendIDA onlyIDA totalIndiaIndonesiaIran, Islamic Rep.IraqIrelandIsraelItalyJamaicaJapanJordanKazakhstanKenyaKiribatiKorea, Rep.KuwaitKyrgyz RepublicLao PDRLate-demographic dividendLatin America & Caribbean Latin America & Caribbean (excluding high income)Latin America & the Caribbean (IDA & IBRD countries)LatviaLeast developed countries: UN classificationLebanonLesothoLiberiaLibyaLithuaniaLow & middle incomeLower middle incomeLuxembourgMacao SAR, ChinaMacedonia, FYRMadagascarMalawiMalaysiaMaldivesMaliMaltaMauritaniaMauritiusMexicoMiddle East & North AfricaMiddle East & North Africa (excluding high income)Middle East & North Africa (IDA & IBRD countries)Middle incomeMoldovaMongoliaMoroccoMozambiqueMyanmarNamibiaNepalNetherlandsNew CaledoniaNew ZealandNicaraguaNigerNigeriaNorth AmericaNorwayOECD membersOmanOther small statesPacific island small statesPakistanPalauPanamaPapua New GuineaParaguayPeruPhilippinesPolandPortugalPost-demographic dividendPre-demographic dividendQatarRomaniaRussian FederationRwandaSamoaSao Tome and PrincipeSaudi ArabiaSenegalSerbiaSeychellesSierra LeoneSingaporeSlovak RepublicSloveniaSmall statesSolomon IslandsSomaliaSouth AfricaSouth AsiaSouth Asia (IDA & IBRD)SpainSri LankaSt. Kitts and NevisSt. LuciaSt. Vincent and the GrenadinesSub-Saharan Africa Sub-Saharan Africa (excluding high income)Sub-Saharan Africa (IDA & IBRD countries)SudanSurinameSwazilandSwedenSwitzerlandSyrian Arab RepublicTajikistanTanzaniaThailandTimor-LesteTogoTongaTrinidad and TobagoTunisiaTurkeyTurkmenistanTurks and Caicos IslandsTuvaluUgandaUkraineUnited Arab EmiratesUnited KingdomUnited StatesUpper middle incomeUruguayVanuatuVenezuela, RBVietnamVirgin Islands (U.S.)WorldYemen, Rep.ZambiaZimbabwe Timeline:
This timeline shows a graph from 1964 to 2016 of Australia. No data until 1963. Number of actual observations by date: 53.
Source name:
World Development Indicators
Source organization:
World Bank staff estimates from the Comtrade database maintained by the United Nations Statistics Division.
Categories, topics:
Private Sector, Trade
Last updated:
apr 23, 2017
Indicators value changes by year
Minimum:
11.289
jan 1, 2011
Maximum:
41.367
jan 1, 1968
At the date of observation
Value
Absolute change
Change from previous value
jan 1, 1964
39.835
+39.835
0.0%
jan 1, 1965
39.786
-0.049
-0.12%
jan 1, 1966
39.577
-0.209
-0.53%
jan 1, 1967
36.355
-3.222
-8.14%
jan 1, 1968
41.367
+5.012
13.78%
jan 1, 1969
34.092
-7.275
-17.59%
jan 1, 1970
32.805
-1.287
-3.78%
jan 1, 1971
34.014
+1.209
3.68%
jan 1, 1972
38.339
+4.325
12.72%
jan 1, 1973
36.911
-1.428
-3.72%
jan 1, 1974
31.935
-4.976
-13.48%
jan 1, 1975
34.543
+2.608
8.17%
jan 1, 1976
35.642
+1.099
3.18%
jan 1, 1977
32.695
-2.947
-8.27%
jan 1, 1978
31.76
-0.936
-2.86%
jan 1, 1979
29.492
-2.268
-7.14%
jan 1, 1980
33.772
+4.28
14.51%
jan 1, 1981
34.43
+0.658
1.95%
jan 1, 1982
30.986
-3.445
-10.0%
jan 1, 1983
30.634
-0.351
-1.13%
jan 1, 1984
25.019
-5.615
-18.33%
jan 1, 1985
28.67
+3.652
14.6%
jan 1, 1986
24.834
-3.836
-13.38%
jan 1, 1987
27.347
+2.512
10.12%
jan 1, 1988
24.181
-3.165
-11.58%
jan 1, 1989
22.432
-1.75
-7.24%
jan 1, 1990
23.696
+1.264
5.64%
jan 1, 1991
22.743
-0.953
-4.02%
jan 1, 1992
20.923
-1.819
-8.0%
jan 1, 1993
22.073
+1.149
5.49%
jan 1, 1994
24.344
+2.272
10.29%
jan 1, 1995
24.942
+0.597
2.45%
jan 1, 1996
22.216
-2.726
-10.93%
jan 1, 1997
24.844
+2.629
11.83%
jan 1, 1998
24.427
-0.417
-1.68%
jan 1, 1999
22.26
-2.167
-8.87%
jan 1, 2000
24.582
+2.322
10.43%
jan 1, 2001
20.652
-3.93
-15.99%
jan 1, 2002
21.491
+0.84
4.07%
jan 1, 2003
21.756
+0.265
1.23%
jan 1, 2004
19.311
-2.445
-11.24%
jan 1, 2005
21.755
+2.445
12.66%
jan 1, 2006
16.829
-4.926
-22.64%
jan 1, 2007
15.387
-1.442
-8.57%
jan 1, 2008
13.54
-1.848
-12.01%
jan 1, 2009
12.334
-1.205
-8.9%
jan 1, 2010
14.07
+1.736
14.07%
jan 1, 2011
11.289
-2.781
-19.77%
jan 1, 2012
11.541
+0.252
2.23%
jan 1, 2013
12.783
+1.241
10.76%
jan 1, 2014
13.099
+0.317
2.48%
jan 1, 2015
14.006
+0.907
6.93%
jan 1, 2016
17.19
+3.183
22.73%
Ranking of countries by current statistics by years


Comments: