29
/
en
AIzaSyAYiBZKx7MnpbEhh9jyipgxe19OcubqV5w
April 1, 2024
139245
Germany
DEU
true
2
1
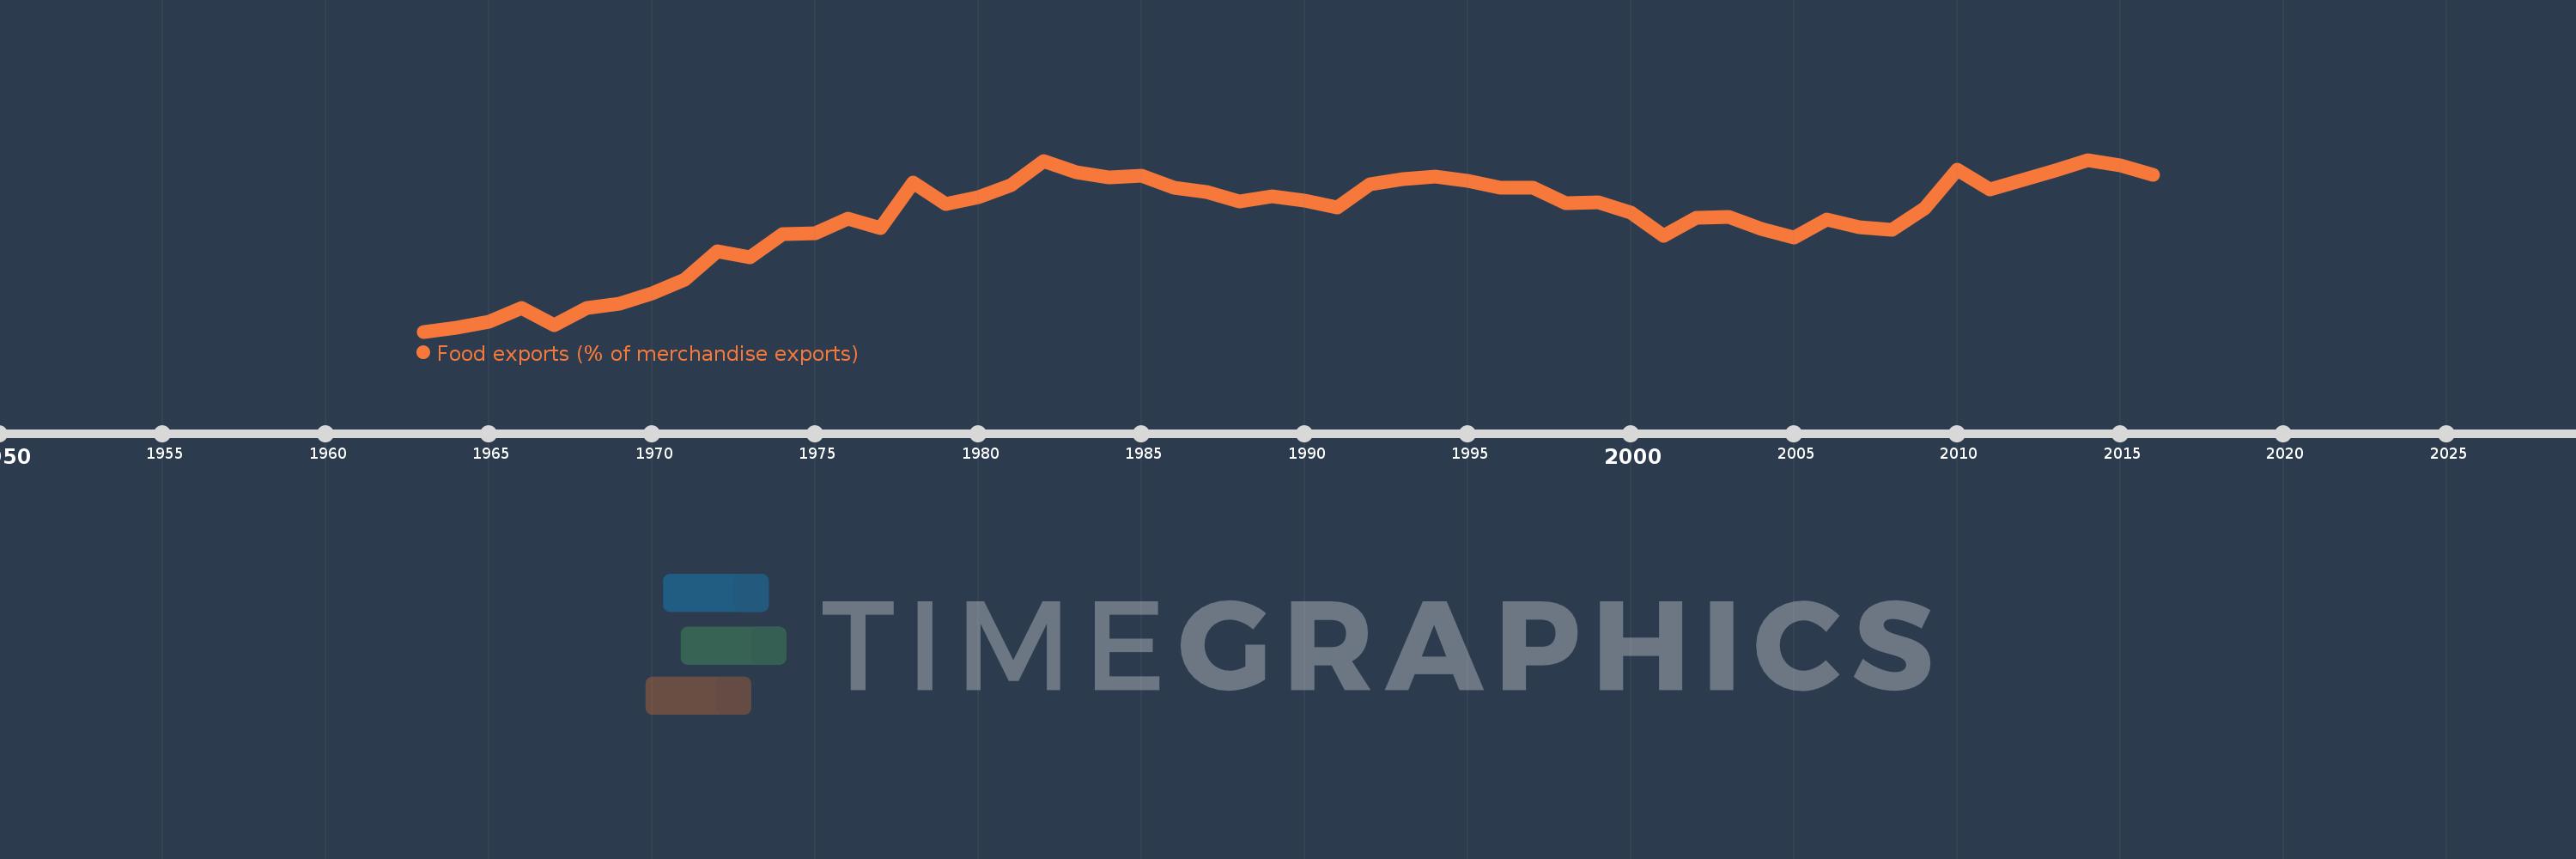
Food exports (% of merchandise exports)
2016,2015,2014,2013,2012,2011,2010,2009,2008,2007,2006,2005,2004,2003,2002,2001,2000,1999,1998,1997,1996,1995,1994,1993,1992,1991,1990,1989,1988,1987,1986,1985,1984,1983,1982,1981,1980,1979,1978,1977,1976,1975,1974,1973,1972,1971,1970,1969,1968,1967,1966,1965,1964,1963
This statistics in other country:
AfghanistanAlbaniaAlgeriaAndorraAngolaAntigua and BarbudaArab WorldArgentinaArmeniaArubaAustraliaAustriaAzerbaijanBahamas, TheBahrainBangladeshBarbadosBelarusBelgiumBelizeBeninBermudaBhutanBoliviaBosnia and HerzegovinaBotswanaBrazilBrunei DarussalamBulgariaBurkina FasoBurundiCabo VerdeCambodiaCameroonCanadaCaribbean small statesCayman IslandsCentral African RepublicCentral Europe and the BalticsChadChileChinaColombiaComorosCongo, Dem. Rep.Congo, Rep.Costa RicaCote d'IvoireCroatiaCubaCyprusCzech RepublicDenmarkDjiboutiDominicaDominican RepublicEarly-demographic dividendEast Asia & PacificEast Asia & Pacific (excluding high income)East Asia & Pacific (IDA & IBRD countries)EcuadorEgypt, Arab Rep.El SalvadorEquatorial GuineaEritreaEstoniaEthiopiaEuro areaEurope & Central AsiaEurope & Central Asia (excluding high income)Europe & Central Asia (IDA & IBRD countries)European UnionFaroe IslandsFijiFinlandFragile and conflict affected situationsFranceFrench PolynesiaGabonGambia, TheGeorgiaGermanyGhanaGreeceGreenlandGrenadaGuatemalaGuineaGuinea-BissauGuyanaHaitiHeavily indebted poor countries (HIPC)High incomeHondurasHong Kong SAR, ChinaHungaryIBRD onlyIcelandIDA & IBRD totalIDA blendIDA onlyIDA totalIndiaIndonesiaIran, Islamic Rep.IraqIrelandIsraelItalyJamaicaJapanJordanKazakhstanKenyaKiribatiKorea, Rep.KuwaitKyrgyz RepublicLao PDRLate-demographic dividendLatin America & Caribbean Latin America & Caribbean (excluding high income)Latin America & the Caribbean (IDA & IBRD countries)LatviaLeast developed countries: UN classificationLebanonLesothoLiberiaLibyaLithuaniaLow & middle incomeLower middle incomeLuxembourgMacao SAR, ChinaMacedonia, FYRMadagascarMalawiMalaysiaMaldivesMaliMaltaMauritaniaMauritiusMexicoMiddle East & North AfricaMiddle East & North Africa (excluding high income)Middle East & North Africa (IDA & IBRD countries)Middle incomeMoldovaMongoliaMoroccoMozambiqueMyanmarNamibiaNepalNetherlandsNew CaledoniaNew ZealandNicaraguaNigerNigeriaNorth AmericaNorwayOECD membersOmanOther small statesPacific island small statesPakistanPalauPanamaPapua New GuineaParaguayPeruPhilippinesPolandPortugalPost-demographic dividendPre-demographic dividendQatarRomaniaRussian FederationRwandaSamoaSao Tome and PrincipeSaudi ArabiaSenegalSerbiaSeychellesSierra LeoneSingaporeSlovak RepublicSloveniaSmall statesSolomon IslandsSomaliaSouth AfricaSouth AsiaSouth Asia (IDA & IBRD)SpainSri LankaSt. Kitts and NevisSt. LuciaSt. Vincent and the GrenadinesSub-Saharan Africa Sub-Saharan Africa (excluding high income)Sub-Saharan Africa (IDA & IBRD countries)SudanSurinameSwazilandSwedenSwitzerlandSyrian Arab RepublicTajikistanTanzaniaThailandTimor-LesteTogoTongaTrinidad and TobagoTunisiaTurkeyTurkmenistanTurks and Caicos IslandsTuvaluUgandaUkraineUnited Arab EmiratesUnited KingdomUnited StatesUpper middle incomeUruguayVanuatuVenezuela, RBVietnamVirgin Islands (U.S.)WorldYemen, Rep.ZambiaZimbabwe Timeline:
This timeline shows a graph from 1963 to 2016 of Germany. No data until 1962. Number of actual observations by date: 54.
Source name:
World Development Indicators
Source organization:
World Bank staff estimates from the Comtrade database maintained by the United Nations Statistics Division.
Categories, topics:
Private Sector, Trade
Last updated:
apr 23, 2017
Indicators value changes by year
At the date of observation
Value
Absolute change
Change from previous value
jan 1, 1963
2.052
+2.052
0.0%
jan 1, 1964
2.139
+0.087
4.26%
jan 1, 1965
2.274
+0.135
6.33%
jan 1, 1966
2.568
+0.293
12.89%
jan 1, 1967
2.199
-0.369
-14.36%
jan 1, 1968
2.575
+0.376
17.11%
jan 1, 1969
2.669
+0.094
3.67%
jan 1, 1970
2.891
+0.222
8.3%
jan 1, 1971
3.191
+0.3
10.39%
jan 1, 1972
3.822
+0.631
19.76%
jan 1, 1973
3.689
-0.133
-3.47%
jan 1, 1974
4.203
+0.514
13.94%
jan 1, 1975
4.219
+0.016
0.38%
jan 1, 1976
4.554
+0.335
7.94%
jan 1, 1977
4.341
-0.213
-4.68%
jan 1, 1978
5.336
+0.995
22.92%
jan 1, 1979
4.864
-0.472
-8.85%
jan 1, 1980
5.015
+0.151
3.11%
jan 1, 1981
5.278
+0.263
5.24%
jan 1, 1982
5.818
+0.539
10.22%
jan 1, 1983
5.567
-0.251
-4.31%
jan 1, 1984
5.456
-0.112
-2.01%
jan 1, 1985
5.486
+0.03
0.56%
jan 1, 1986
5.226
-0.26
-4.73%
jan 1, 1987
5.125
-0.101
-1.94%
jan 1, 1988
4.915
-0.21
-4.09%
jan 1, 1989
5.045
+0.129
2.63%
jan 1, 1990
4.947
-0.098
-1.94%
jan 1, 1991
4.788
-0.159
-3.22%
jan 1, 1992
5.302
+0.514
10.74%
jan 1, 1993
5.422
+0.119
2.25%
jan 1, 1994
5.472
+0.05
0.92%
jan 1, 1995
5.384
-0.087
-1.6%
jan 1, 1996
5.232
-0.152
-2.83%
jan 1, 1997
5.234
+0.002
0.04%
jan 1, 1998
4.894
-0.34
-6.5%
jan 1, 1999
4.902
+0.008
0.17%
jan 1, 2000
4.674
-0.228
-4.65%
jan 1, 2001
4.163
-0.511
-10.93%
jan 1, 2002
4.565
+0.402
9.66%
jan 1, 2003
4.581
+0.015
0.33%
jan 1, 2004
4.309
-0.271
-5.93%
jan 1, 2005
4.128
-0.182
-4.21%
jan 1, 2006
4.517
+0.389
9.44%
jan 1, 2007
4.363
-0.154
-3.42%
jan 1, 2008
4.308
-0.055
-1.25%
jan 1, 2009
4.779
+0.471
10.93%
jan 1, 2010
5.617
+0.838
17.54%
jan 1, 2011
5.194
-0.423
-7.53%
jan 1, 2012
5.401
+0.207
3.99%
jan 1, 2013
5.606
+0.204
3.78%
jan 1, 2014
5.844
+0.239
4.26%
jan 1, 2015
5.718
-0.126
-2.16%
jan 1, 2016
5.508
-0.21
-3.68%
Ranking of countries by current statistics by years


Comments: