29
/
en
AIzaSyAYiBZKx7MnpbEhh9jyipgxe19OcubqV5w
April 1, 2024
45067
Low & middle income
LMY
false
2
1
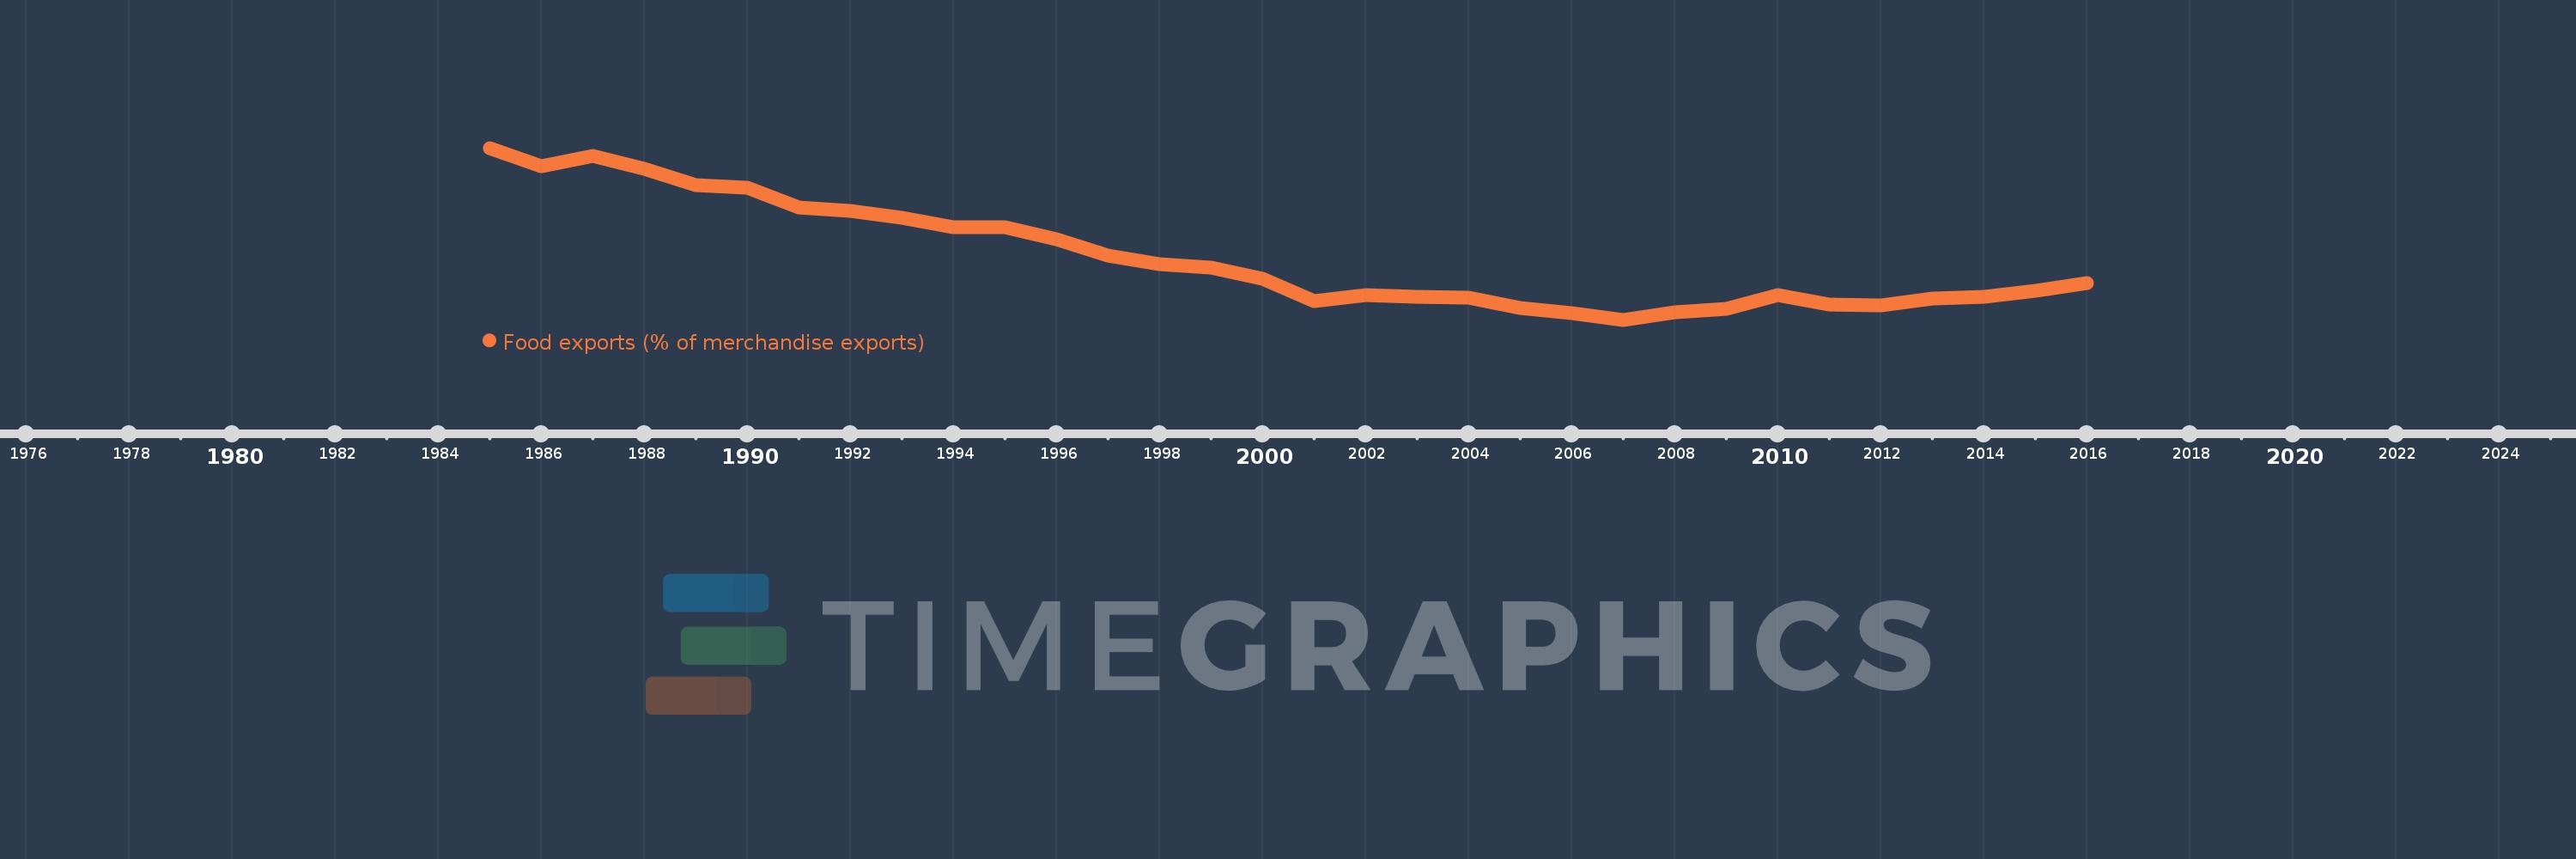
Food exports (% of merchandise exports)
2016,2015,2014,2013,2012,2011,2010,2009,2008,2007,2006,2005,2004,2003,2002,2001,2000,1999,1998,1997,1996,1995,1994,1993,1992,1991,1990,1989,1988,1987,1986,1985
This statistics in other country:
AfghanistanAlbaniaAlgeriaAndorraAngolaAntigua and BarbudaArab WorldArgentinaArmeniaArubaAustraliaAustriaAzerbaijanBahamas, TheBahrainBangladeshBarbadosBelarusBelgiumBelizeBeninBermudaBhutanBoliviaBosnia and HerzegovinaBotswanaBrazilBrunei DarussalamBulgariaBurkina FasoBurundiCabo VerdeCambodiaCameroonCanadaCaribbean small statesCayman IslandsCentral African RepublicCentral Europe and the BalticsChadChileChinaColombiaComorosCongo, Dem. Rep.Congo, Rep.Costa RicaCote d'IvoireCroatiaCubaCyprusCzech RepublicDenmarkDjiboutiDominicaDominican RepublicEarly-demographic dividendEast Asia & PacificEast Asia & Pacific (excluding high income)East Asia & Pacific (IDA & IBRD countries)EcuadorEgypt, Arab Rep.El SalvadorEquatorial GuineaEritreaEstoniaEthiopiaEuro areaEurope & Central AsiaEurope & Central Asia (excluding high income)Europe & Central Asia (IDA & IBRD countries)European UnionFaroe IslandsFijiFinlandFragile and conflict affected situationsFranceFrench PolynesiaGabonGambia, TheGeorgiaGermanyGhanaGreeceGreenlandGrenadaGuatemalaGuineaGuinea-BissauGuyanaHaitiHeavily indebted poor countries (HIPC)High incomeHondurasHong Kong SAR, ChinaHungaryIBRD onlyIcelandIDA & IBRD totalIDA blendIDA onlyIDA totalIndiaIndonesiaIran, Islamic Rep.IraqIrelandIsraelItalyJamaicaJapanJordanKazakhstanKenyaKiribatiKorea, Rep.KuwaitKyrgyz RepublicLao PDRLate-demographic dividendLatin America & Caribbean Latin America & Caribbean (excluding high income)Latin America & the Caribbean (IDA & IBRD countries)LatviaLeast developed countries: UN classificationLebanonLesothoLiberiaLibyaLithuaniaLow & middle incomeLower middle incomeLuxembourgMacao SAR, ChinaMacedonia, FYRMadagascarMalawiMalaysiaMaldivesMaliMaltaMauritaniaMauritiusMexicoMiddle East & North AfricaMiddle East & North Africa (excluding high income)Middle East & North Africa (IDA & IBRD countries)Middle incomeMoldovaMongoliaMoroccoMozambiqueMyanmarNamibiaNepalNetherlandsNew CaledoniaNew ZealandNicaraguaNigerNigeriaNorth AmericaNorwayOECD membersOmanOther small statesPacific island small statesPakistanPalauPanamaPapua New GuineaParaguayPeruPhilippinesPolandPortugalPost-demographic dividendPre-demographic dividendQatarRomaniaRussian FederationRwandaSamoaSao Tome and PrincipeSaudi ArabiaSenegalSerbiaSeychellesSierra LeoneSingaporeSlovak RepublicSloveniaSmall statesSolomon IslandsSomaliaSouth AfricaSouth AsiaSouth Asia (IDA & IBRD)SpainSri LankaSt. Kitts and NevisSt. LuciaSt. Vincent and the GrenadinesSub-Saharan Africa Sub-Saharan Africa (excluding high income)Sub-Saharan Africa (IDA & IBRD countries)SudanSurinameSwazilandSwedenSwitzerlandSyrian Arab RepublicTajikistanTanzaniaThailandTimor-LesteTogoTongaTrinidad and TobagoTunisiaTurkeyTurkmenistanTurks and Caicos IslandsTuvaluUgandaUkraineUnited Arab EmiratesUnited KingdomUnited StatesUpper middle incomeUruguayVanuatuVenezuela, RBVietnamVirgin Islands (U.S.)WorldYemen, Rep.ZambiaZimbabwe Timeline:
This timeline shows a graph from 1985 to 2016 of Low & middle income. No data until 1984. Number of actual observations by date: 32.
Source name:
World Development Indicators
Source organization:
World Bank staff estimates from the Comtrade database maintained by the United Nations Statistics Division.
Categories, topics:
Private Sector, Trade
Last updated:
apr 23, 2017
Indicators value changes by year
Maximum:
20.748
jan 1, 1985
At the date of observation
Value
Absolute change
Change from previous value
jan 1, 1985
20.748
+20.748
0.0%
jan 1, 1986
19.37
-1.378
-6.64%
jan 1, 1987
20.16
+0.791
4.08%
jan 1, 1988
19.218
-0.942
-4.67%
jan 1, 1989
17.96
-1.258
-6.55%
jan 1, 1990
17.766
-0.195
-1.08%
jan 1, 1991
16.342
-1.423
-8.01%
jan 1, 1992
16.036
-0.306
-1.87%
jan 1, 1993
15.528
-0.508
-3.17%
jan 1, 1994
14.826
-0.703
-4.52%
jan 1, 1995
14.872
+0.046
0.31%
jan 1, 1996
13.964
-0.908
-6.1%
jan 1, 1997
12.746
-1.218
-8.73%
jan 1, 1998
12.117
-0.629
-4.94%
jan 1, 1999
11.821
-0.296
-2.44%
jan 1, 2000
11.004
-0.817
-6.91%
jan 1, 2001
9.36
-1.644
-14.94%
jan 1, 2002
9.773
+0.413
4.42%
jan 1, 2003
9.7
-0.073
-0.75%
jan 1, 2004
9.611
-0.089
-0.91%
jan 1, 2005
8.871
-0.74
-7.7%
jan 1, 2006
8.492
-0.38
-4.28%
jan 1, 2007
7.97
-0.521
-6.14%
jan 1, 2008
8.498
+0.527
6.62%
jan 1, 2009
8.792
+0.294
3.46%
jan 1, 2010
9.816
+1.025
11.65%
jan 1, 2011
9.104
-0.712
-7.26%
jan 1, 2012
9.03
-0.074
-0.81%
jan 1, 2013
9.53
+0.5
5.53%
jan 1, 2014
9.655
+0.125
1.32%
jan 1, 2015
10.109
+0.453
4.7%
jan 1, 2016
10.668
+0.559
5.53%
Ranking of countries by current statistics by years


Comments: