29
/
en
AIzaSyAYiBZKx7MnpbEhh9jyipgxe19OcubqV5w
April 1, 2024
269305
Turkey
TUR
true
2
1
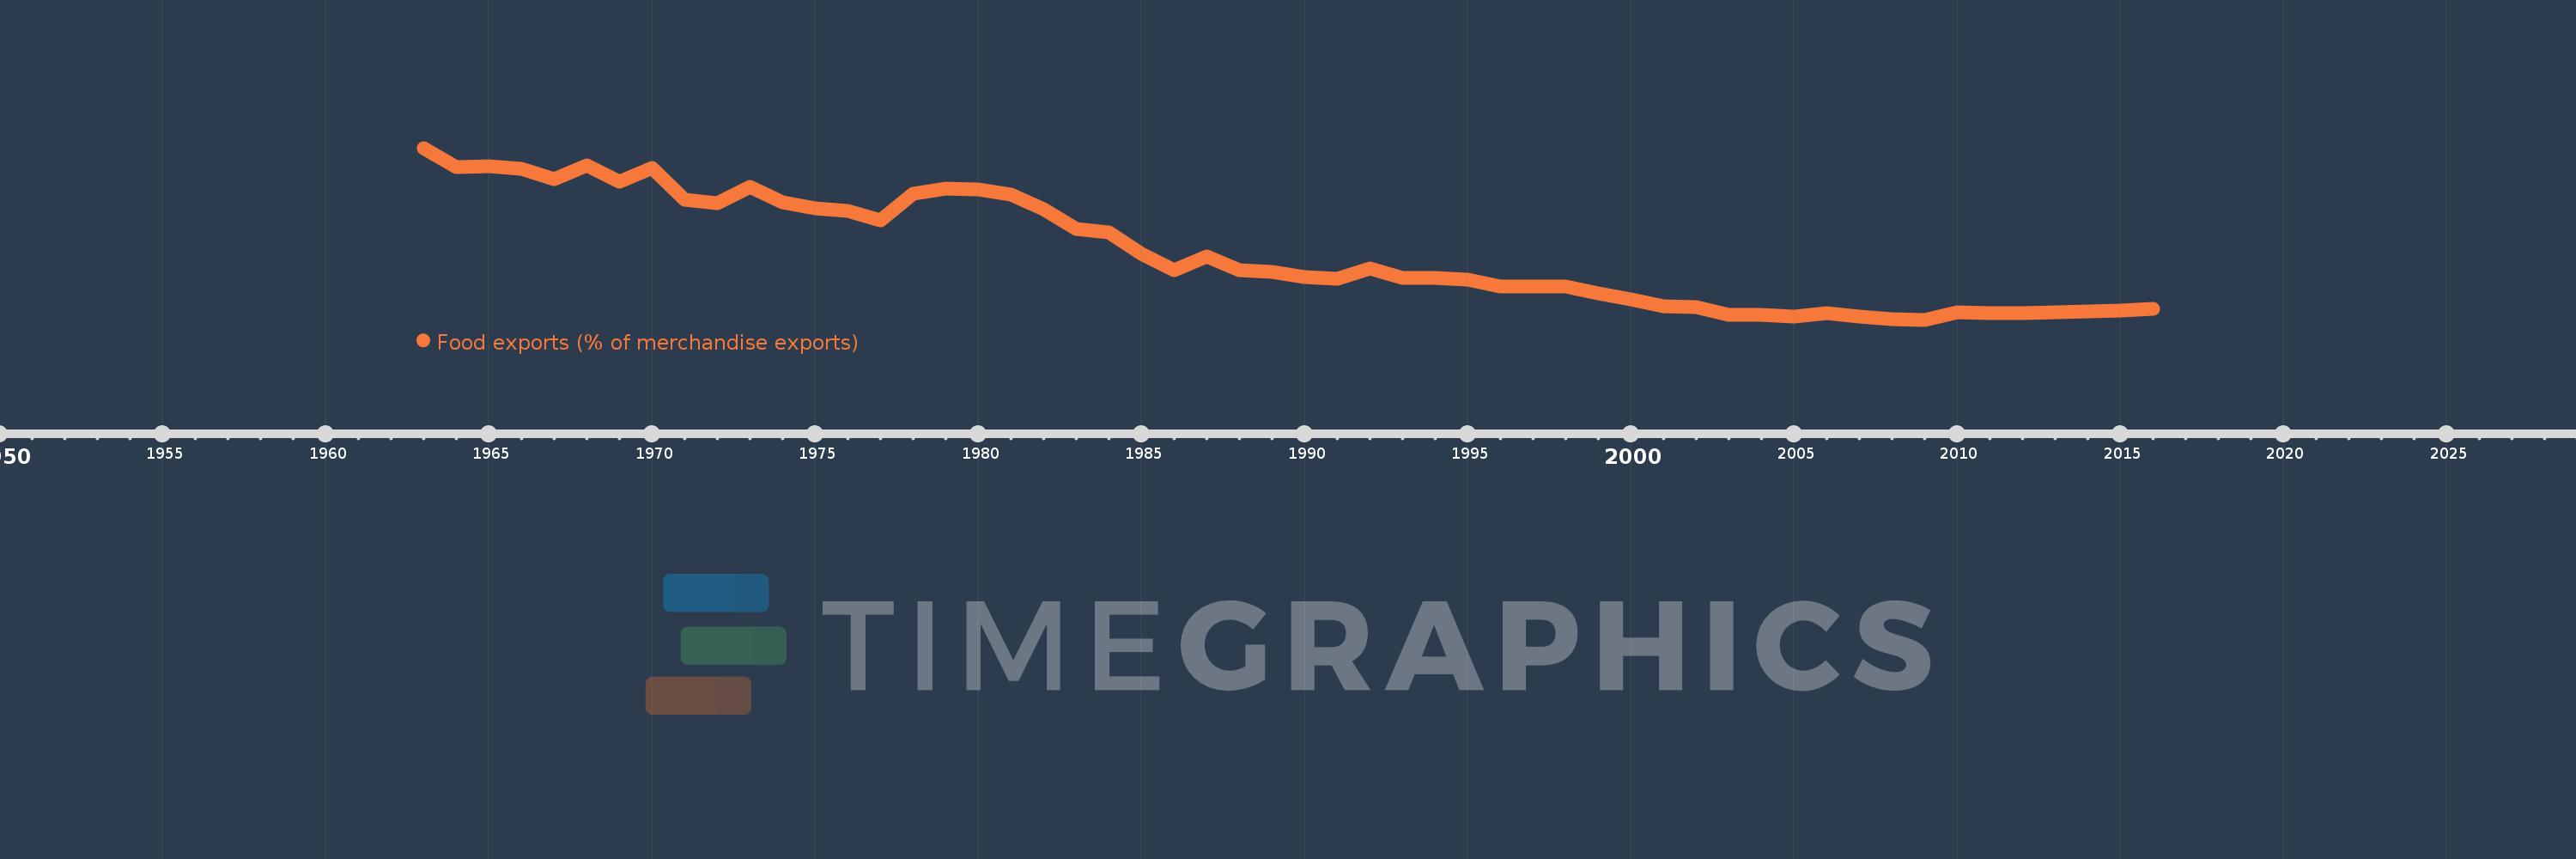
Food exports (% of merchandise exports)
2016,2015,2014,2013,2012,2011,2010,2009,2008,2007,2006,2005,2004,2003,2002,2001,2000,1999,1998,1997,1996,1995,1994,1993,1992,1991,1990,1989,1988,1987,1986,1985,1984,1983,1982,1981,1980,1979,1978,1977,1976,1975,1974,1973,1972,1971,1970,1969,1968,1967,1966,1965,1964,1963
This statistics in other country:
AfghanistanAlbaniaAlgeriaAndorraAngolaAntigua and BarbudaArab WorldArgentinaArmeniaArubaAustraliaAustriaAzerbaijanBahamas, TheBahrainBangladeshBarbadosBelarusBelgiumBelizeBeninBermudaBhutanBoliviaBosnia and HerzegovinaBotswanaBrazilBrunei DarussalamBulgariaBurkina FasoBurundiCabo VerdeCambodiaCameroonCanadaCaribbean small statesCayman IslandsCentral African RepublicCentral Europe and the BalticsChadChileChinaColombiaComorosCongo, Dem. Rep.Congo, Rep.Costa RicaCote d'IvoireCroatiaCubaCyprusCzech RepublicDenmarkDjiboutiDominicaDominican RepublicEarly-demographic dividendEast Asia & PacificEast Asia & Pacific (excluding high income)East Asia & Pacific (IDA & IBRD countries)EcuadorEgypt, Arab Rep.El SalvadorEquatorial GuineaEritreaEstoniaEthiopiaEuro areaEurope & Central AsiaEurope & Central Asia (excluding high income)Europe & Central Asia (IDA & IBRD countries)European UnionFaroe IslandsFijiFinlandFragile and conflict affected situationsFranceFrench PolynesiaGabonGambia, TheGeorgiaGermanyGhanaGreeceGreenlandGrenadaGuatemalaGuineaGuinea-BissauGuyanaHaitiHeavily indebted poor countries (HIPC)High incomeHondurasHong Kong SAR, ChinaHungaryIBRD onlyIcelandIDA & IBRD totalIDA blendIDA onlyIDA totalIndiaIndonesiaIran, Islamic Rep.IraqIrelandIsraelItalyJamaicaJapanJordanKazakhstanKenyaKiribatiKorea, Rep.KuwaitKyrgyz RepublicLao PDRLate-demographic dividendLatin America & Caribbean Latin America & Caribbean (excluding high income)Latin America & the Caribbean (IDA & IBRD countries)LatviaLeast developed countries: UN classificationLebanonLesothoLiberiaLibyaLithuaniaLow & middle incomeLower middle incomeLuxembourgMacao SAR, ChinaMacedonia, FYRMadagascarMalawiMalaysiaMaldivesMaliMaltaMauritaniaMauritiusMexicoMiddle East & North AfricaMiddle East & North Africa (excluding high income)Middle East & North Africa (IDA & IBRD countries)Middle incomeMoldovaMongoliaMoroccoMozambiqueMyanmarNamibiaNepalNetherlandsNew CaledoniaNew ZealandNicaraguaNigerNigeriaNorth AmericaNorwayOECD membersOmanOther small statesPacific island small statesPakistanPalauPanamaPapua New GuineaParaguayPeruPhilippinesPolandPortugalPost-demographic dividendPre-demographic dividendQatarRomaniaRussian FederationRwandaSamoaSao Tome and PrincipeSaudi ArabiaSenegalSerbiaSeychellesSierra LeoneSingaporeSlovak RepublicSloveniaSmall statesSolomon IslandsSomaliaSouth AfricaSouth AsiaSouth Asia (IDA & IBRD)SpainSri LankaSt. Kitts and NevisSt. LuciaSt. Vincent and the GrenadinesSub-Saharan Africa Sub-Saharan Africa (excluding high income)Sub-Saharan Africa (IDA & IBRD countries)SudanSurinameSwazilandSwedenSwitzerlandSyrian Arab RepublicTajikistanTanzaniaThailandTimor-LesteTogoTongaTrinidad and TobagoTunisiaTurkeyTurkmenistanTurks and Caicos IslandsTuvaluUgandaUkraineUnited Arab EmiratesUnited KingdomUnited StatesUpper middle incomeUruguayVanuatuVenezuela, RBVietnamVirgin Islands (U.S.)WorldYemen, Rep.ZambiaZimbabwe Timeline:
This timeline shows a graph from 1963 to 2016 of Turkey. No data until 1962. Number of actual observations by date: 54.
Source name:
World Development Indicators
Source organization:
World Bank staff estimates from the Comtrade database maintained by the United Nations Statistics Division.
Categories, topics:
Private Sector, Trade
Last updated:
apr 23, 2017
Indicators value changes by year
Maximum:
66.992
jan 1, 1963
At the date of observation
Value
Absolute change
Change from previous value
jan 1, 1963
66.992
+66.992
0.0%
jan 1, 1964
60.54
-6.452
-9.63%
jan 1, 1965
60.678
+0.138
0.23%
jan 1, 1966
59.799
-0.879
-1.45%
jan 1, 1967
56.297
-3.502
-5.86%
jan 1, 1968
60.916
+4.62
8.21%
jan 1, 1969
55.359
-5.558
-9.12%
jan 1, 1970
60.079
+4.72
8.53%
jan 1, 1971
49.279
-10.8
-17.98%
jan 1, 1972
48.086
-1.192
-2.42%
jan 1, 1973
53.576
+5.49
11.42%
jan 1, 1974
48.514
-5.063
-9.45%
jan 1, 1975
46.472
-2.041
-4.21%
jan 1, 1976
45.45
-1.022
-2.2%
jan 1, 1977
42.151
-3.299
-7.26%
jan 1, 1978
51.304
+9.152
21.71%
jan 1, 1979
53.085
+1.782
3.47%
jan 1, 1980
52.728
-0.357
-0.67%
jan 1, 1981
51.072
-1.657
-3.14%
jan 1, 1982
45.995
-5.077
-9.94%
jan 1, 1983
39.273
-6.722
-14.61%
jan 1, 1984
38.263
-1.01
-2.57%
jan 1, 1985
30.765
-7.498
-19.6%
jan 1, 1986
25.208
-5.556
-18.06%
jan 1, 1987
29.867
+4.659
18.48%
jan 1, 1988
25.304
-4.563
-15.28%
jan 1, 1989
24.51
-0.795
-3.14%
jan 1, 1990
22.945
-1.565
-6.38%
jan 1, 1991
22.405
-0.54
-2.35%
jan 1, 1992
25.954
+3.549
15.84%
jan 1, 1993
22.734
-3.22
-12.41%
jan 1, 1994
22.552
-0.182
-0.8%
jan 1, 1995
21.935
-0.617
-2.74%
jan 1, 1996
19.563
-2.372
-10.81%
jan 1, 1997
19.721
+0.158
0.81%
jan 1, 1998
19.555
-0.166
-0.84%
jan 1, 1999
17.36
-2.194
-11.22%
jan 1, 2000
15.357
-2.003
-11.54%
jan 1, 2001
12.804
-2.553
-16.63%
jan 1, 2002
12.747
-0.056
-0.44%
jan 1, 2003
10.094
-2.653
-20.81%
jan 1, 2004
10.008
-0.086
-0.86%
jan 1, 2005
9.314
-0.693
-6.93%
jan 1, 2006
10.494
+1.179
12.66%
jan 1, 2007
9.32
-1.173
-11.18%
jan 1, 2008
8.442
-0.878
-9.42%
jan 1, 2009
8.302
-0.14
-1.65%
jan 1, 2010
10.825
+2.523
30.39%
jan 1, 2011
10.577
-0.248
-2.3%
jan 1, 2012
10.607
+0.03
0.29%
jan 1, 2013
10.768
+0.161
1.52%
jan 1, 2014
11.238
+0.47
4.37%
jan 1, 2015
11.445
+0.207
1.84%
jan 1, 2016
12.095
+0.65
5.68%
Ranking of countries by current statistics by years


Comments: