29
/
en
AIzaSyAYiBZKx7MnpbEhh9jyipgxe19OcubqV5w
April 1, 2024
54054
Pacific island small states
PSS
false
2
1
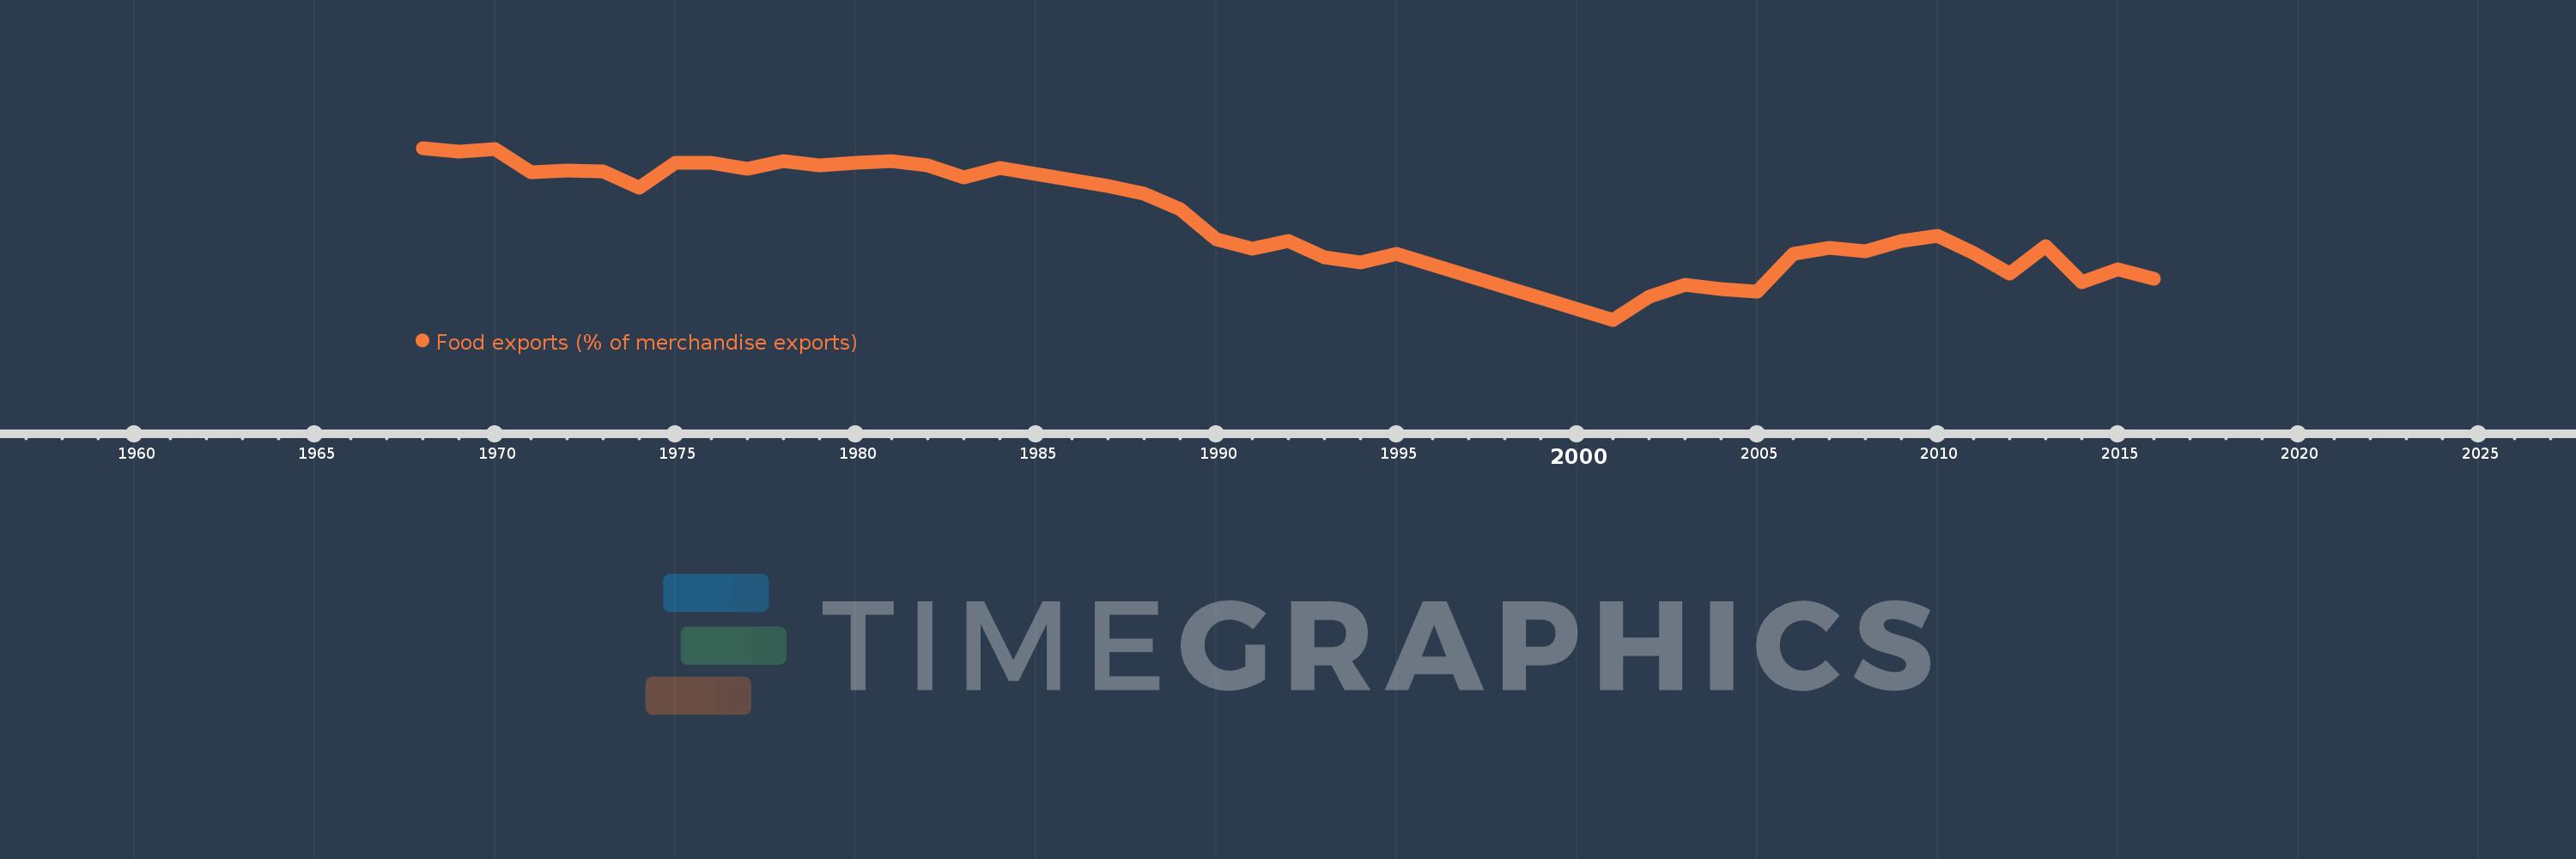
Food exports (% of merchandise exports)
2016,2015,2014,2013,2012,2011,2010,2009,2008,2007,2006,2005,2004,2003,2002,2001,1995,1994,1993,1992,1991,1990,1989,1988,1987,1986,1985,1984,1983,1982,1981,1980,1979,1978,1977,1976,1975,1974,1973,1972,1971,1970,1969,1968
This statistics in other country:
AfghanistanAlbaniaAlgeriaAndorraAngolaAntigua and BarbudaArab WorldArgentinaArmeniaArubaAustraliaAustriaAzerbaijanBahamas, TheBahrainBangladeshBarbadosBelarusBelgiumBelizeBeninBermudaBhutanBoliviaBosnia and HerzegovinaBotswanaBrazilBrunei DarussalamBulgariaBurkina FasoBurundiCabo VerdeCambodiaCameroonCanadaCaribbean small statesCayman IslandsCentral African RepublicCentral Europe and the BalticsChadChileChinaColombiaComorosCongo, Dem. Rep.Congo, Rep.Costa RicaCote d'IvoireCroatiaCubaCyprusCzech RepublicDenmarkDjiboutiDominicaDominican RepublicEarly-demographic dividendEast Asia & PacificEast Asia & Pacific (excluding high income)East Asia & Pacific (IDA & IBRD countries)EcuadorEgypt, Arab Rep.El SalvadorEquatorial GuineaEritreaEstoniaEthiopiaEuro areaEurope & Central AsiaEurope & Central Asia (excluding high income)Europe & Central Asia (IDA & IBRD countries)European UnionFaroe IslandsFijiFinlandFragile and conflict affected situationsFranceFrench PolynesiaGabonGambia, TheGeorgiaGermanyGhanaGreeceGreenlandGrenadaGuatemalaGuineaGuinea-BissauGuyanaHaitiHeavily indebted poor countries (HIPC)High incomeHondurasHong Kong SAR, ChinaHungaryIBRD onlyIcelandIDA & IBRD totalIDA blendIDA onlyIDA totalIndiaIndonesiaIran, Islamic Rep.IraqIrelandIsraelItalyJamaicaJapanJordanKazakhstanKenyaKiribatiKorea, Rep.KuwaitKyrgyz RepublicLao PDRLate-demographic dividendLatin America & Caribbean Latin America & Caribbean (excluding high income)Latin America & the Caribbean (IDA & IBRD countries)LatviaLeast developed countries: UN classificationLebanonLesothoLiberiaLibyaLithuaniaLow & middle incomeLower middle incomeLuxembourgMacao SAR, ChinaMacedonia, FYRMadagascarMalawiMalaysiaMaldivesMaliMaltaMauritaniaMauritiusMexicoMiddle East & North AfricaMiddle East & North Africa (excluding high income)Middle East & North Africa (IDA & IBRD countries)Middle incomeMoldovaMongoliaMoroccoMozambiqueMyanmarNamibiaNepalNetherlandsNew CaledoniaNew ZealandNicaraguaNigerNigeriaNorth AmericaNorwayOECD membersOmanOther small statesPacific island small statesPakistanPalauPanamaPapua New GuineaParaguayPeruPhilippinesPolandPortugalPost-demographic dividendPre-demographic dividendQatarRomaniaRussian FederationRwandaSamoaSao Tome and PrincipeSaudi ArabiaSenegalSerbiaSeychellesSierra LeoneSingaporeSlovak RepublicSloveniaSmall statesSolomon IslandsSomaliaSouth AfricaSouth AsiaSouth Asia (IDA & IBRD)SpainSri LankaSt. Kitts and NevisSt. LuciaSt. Vincent and the GrenadinesSub-Saharan Africa Sub-Saharan Africa (excluding high income)Sub-Saharan Africa (IDA & IBRD countries)SudanSurinameSwazilandSwedenSwitzerlandSyrian Arab RepublicTajikistanTanzaniaThailandTimor-LesteTogoTongaTrinidad and TobagoTunisiaTurkeyTurkmenistanTurks and Caicos IslandsTuvaluUgandaUkraineUnited Arab EmiratesUnited KingdomUnited StatesUpper middle incomeUruguayVanuatuVenezuela, RBVietnamVirgin Islands (U.S.)WorldYemen, Rep.ZambiaZimbabwe Timeline:
This timeline shows a graph from 1968 to 2016 of Pacific island small states. No data until 1967. Number of actual observations by date: 44.
Source name:
World Development Indicators
Source organization:
World Bank staff estimates from the Comtrade database maintained by the United Nations Statistics Division.
Categories, topics:
Private Sector, Trade
Last updated:
apr 23, 2017
Indicators value changes by year
Minimum:
39.763
jan 1, 2001
Maximum:
95.517
jan 1, 1968
At the date of observation
Value
Absolute change
Change from previous value
jan 1, 1968
95.517
+95.517
0.0%
jan 1, 1969
94.207
-1.31
-1.37%
jan 1, 1970
95.224
+1.017
1.08%
jan 1, 1971
87.591
-7.633
-8.02%
jan 1, 1972
88.062
+0.47
0.54%
jan 1, 1973
87.897
-0.164
-0.19%
jan 1, 1974
82.574
-5.323
-6.06%
jan 1, 1975
90.71
+8.136
9.85%
jan 1, 1976
90.762
+0.052
0.06%
jan 1, 1977
88.87
-1.892
-2.08%
jan 1, 1978
91.115
+2.245
2.53%
jan 1, 1979
89.958
-1.157
-1.27%
jan 1, 1980
90.662
+0.704
0.78%
jan 1, 1981
91.155
+0.493
0.54%
jan 1, 1982
89.842
-1.313
-1.44%
jan 1, 1983
86.052
-3.79
-4.22%
jan 1, 1984
89.149
+3.097
3.6%
jan 1, 1985
87.178
-1.971
-2.21%
jan 1, 1986
85.115
-2.063
-2.37%
jan 1, 1987
83.074
-2.041
-2.4%
jan 1, 1988
80.752
-2.322
-2.79%
jan 1, 1989
75.73
-5.021
-6.22%
jan 1, 1990
65.867
-9.863
-13.02%
jan 1, 1991
62.896
-2.971
-4.51%
jan 1, 1992
65.45
+2.554
4.06%
jan 1, 1993
60.152
-5.299
-8.1%
jan 1, 1994
58.459
-1.693
-2.81%
jan 1, 1995
61.157
+2.698
4.62%
jan 1, 2001
39.763
-21.394
-34.98%
jan 1, 2002
47.182
+7.419
18.66%
jan 1, 2003
51.236
+4.054
8.59%
jan 1, 2004
49.592
-1.644
-3.21%
jan 1, 2005
48.807
-0.785
-1.58%
jan 1, 2006
61.065
+12.258
25.12%
jan 1, 2007
62.957
+1.892
3.1%
jan 1, 2008
61.89
-1.067
-1.69%
jan 1, 2009
65.38
+3.489
5.64%
jan 1, 2010
66.953
+1.573
2.41%
jan 1, 2011
61.525
-5.428
-8.11%
jan 1, 2012
54.772
-6.753
-10.98%
jan 1, 2013
63.656
+8.884
16.22%
jan 1, 2014
51.914
-11.741
-18.44%
jan 1, 2015
56.015
+4.101
7.9%
jan 1, 2016
53.001
-3.014
-5.38%
Ranking of countries by current statistics by years


Comments: