29
/
en
AIzaSyAYiBZKx7MnpbEhh9jyipgxe19OcubqV5w
April 1, 2024
277649
Uruguay
URY
true
2
1
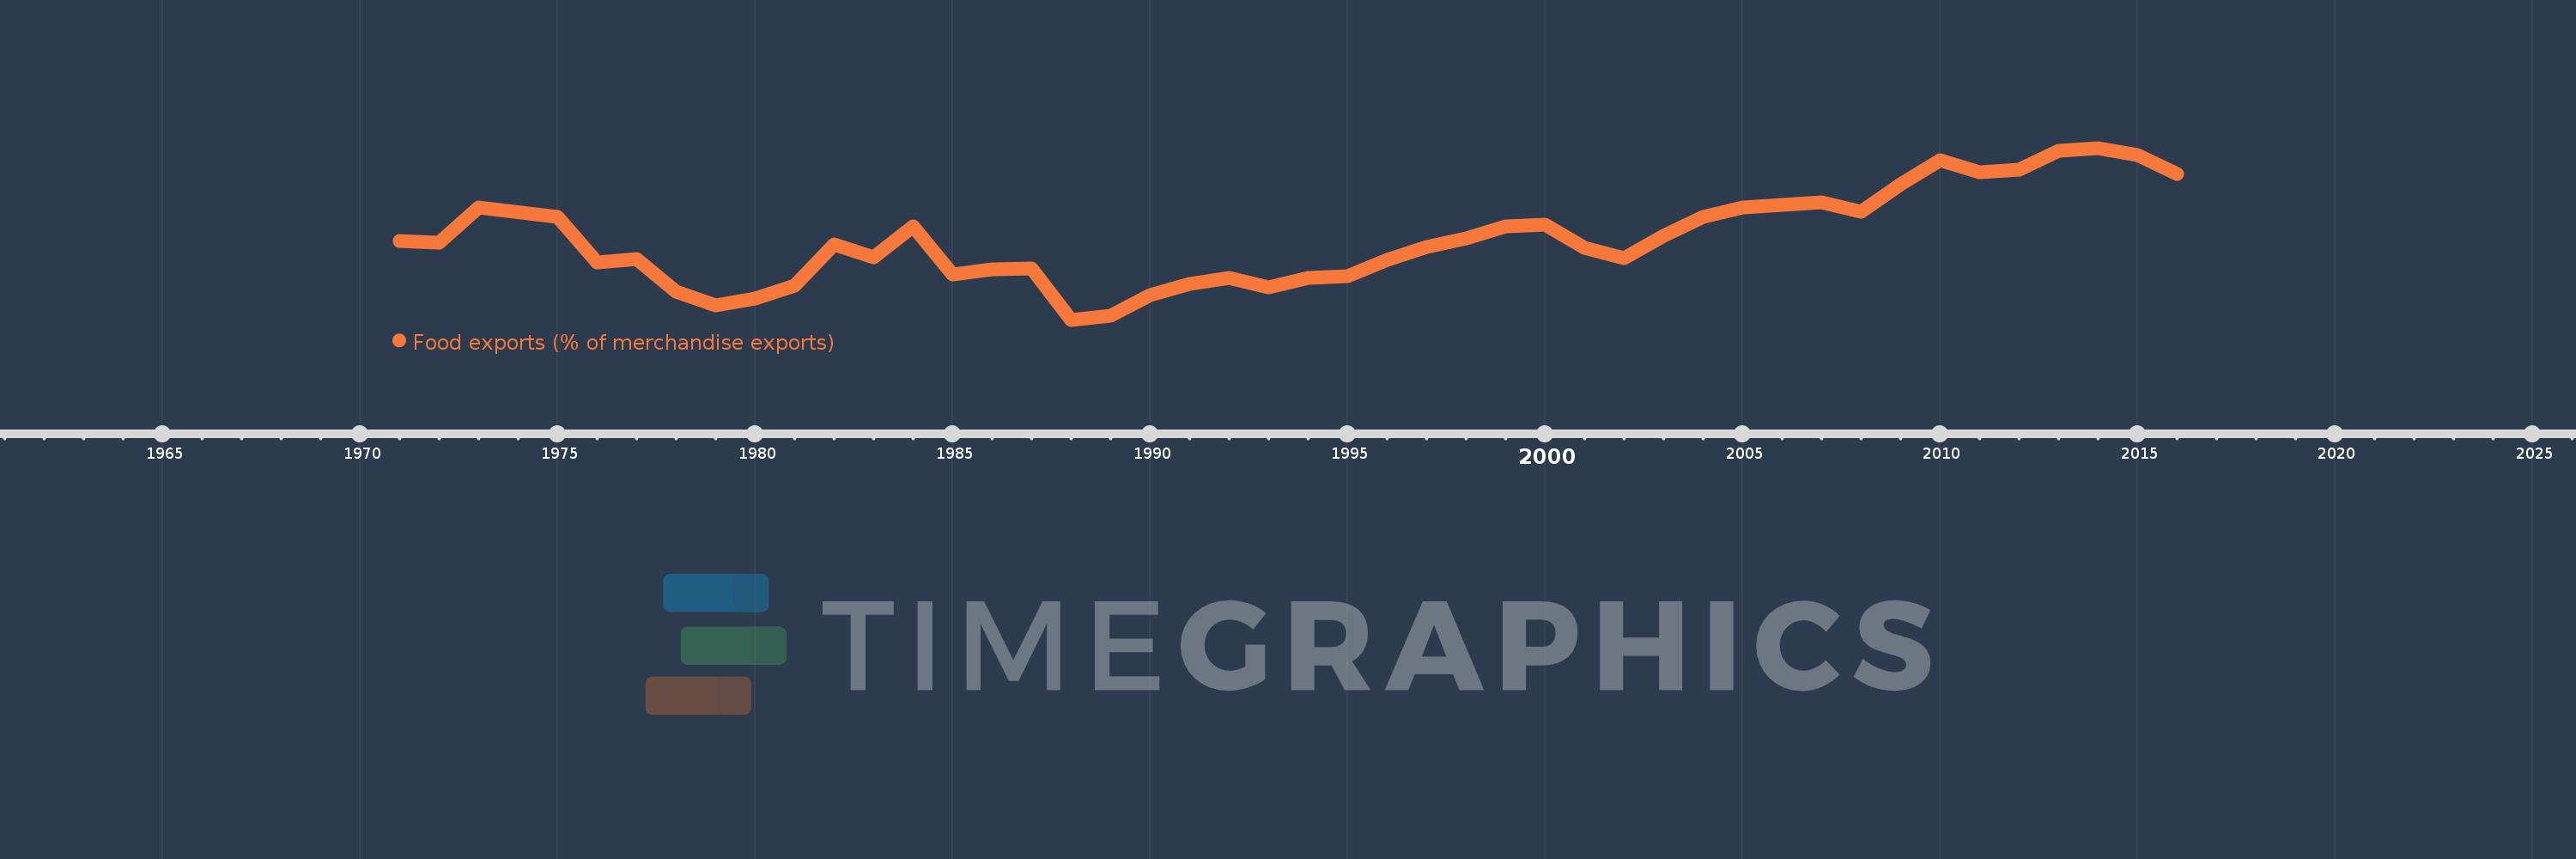
Food exports (% of merchandise exports)
2016,2015,2014,2013,2012,2011,2010,2009,2008,2007,2006,2005,2004,2003,2002,2001,2000,1999,1998,1997,1996,1995,1994,1993,1992,1991,1990,1989,1988,1987,1986,1985,1984,1983,1982,1981,1980,1979,1978,1977,1976,1975,1973,1972,1971
This statistics in other country:
AfghanistanAlbaniaAlgeriaAndorraAngolaAntigua and BarbudaArab WorldArgentinaArmeniaArubaAustraliaAustriaAzerbaijanBahamas, TheBahrainBangladeshBarbadosBelarusBelgiumBelizeBeninBermudaBhutanBoliviaBosnia and HerzegovinaBotswanaBrazilBrunei DarussalamBulgariaBurkina FasoBurundiCabo VerdeCambodiaCameroonCanadaCaribbean small statesCayman IslandsCentral African RepublicCentral Europe and the BalticsChadChileChinaColombiaComorosCongo, Dem. Rep.Congo, Rep.Costa RicaCote d'IvoireCroatiaCubaCyprusCzech RepublicDenmarkDjiboutiDominicaDominican RepublicEarly-demographic dividendEast Asia & PacificEast Asia & Pacific (excluding high income)East Asia & Pacific (IDA & IBRD countries)EcuadorEgypt, Arab Rep.El SalvadorEquatorial GuineaEritreaEstoniaEthiopiaEuro areaEurope & Central AsiaEurope & Central Asia (excluding high income)Europe & Central Asia (IDA & IBRD countries)European UnionFaroe IslandsFijiFinlandFragile and conflict affected situationsFranceFrench PolynesiaGabonGambia, TheGeorgiaGermanyGhanaGreeceGreenlandGrenadaGuatemalaGuineaGuinea-BissauGuyanaHaitiHeavily indebted poor countries (HIPC)High incomeHondurasHong Kong SAR, ChinaHungaryIBRD onlyIcelandIDA & IBRD totalIDA blendIDA onlyIDA totalIndiaIndonesiaIran, Islamic Rep.IraqIrelandIsraelItalyJamaicaJapanJordanKazakhstanKenyaKiribatiKorea, Rep.KuwaitKyrgyz RepublicLao PDRLate-demographic dividendLatin America & Caribbean Latin America & Caribbean (excluding high income)Latin America & the Caribbean (IDA & IBRD countries)LatviaLeast developed countries: UN classificationLebanonLesothoLiberiaLibyaLithuaniaLow & middle incomeLower middle incomeLuxembourgMacao SAR, ChinaMacedonia, FYRMadagascarMalawiMalaysiaMaldivesMaliMaltaMauritaniaMauritiusMexicoMiddle East & North AfricaMiddle East & North Africa (excluding high income)Middle East & North Africa (IDA & IBRD countries)Middle incomeMoldovaMongoliaMoroccoMozambiqueMyanmarNamibiaNepalNetherlandsNew CaledoniaNew ZealandNicaraguaNigerNigeriaNorth AmericaNorwayOECD membersOmanOther small statesPacific island small statesPakistanPalauPanamaPapua New GuineaParaguayPeruPhilippinesPolandPortugalPost-demographic dividendPre-demographic dividendQatarRomaniaRussian FederationRwandaSamoaSao Tome and PrincipeSaudi ArabiaSenegalSerbiaSeychellesSierra LeoneSingaporeSlovak RepublicSloveniaSmall statesSolomon IslandsSomaliaSouth AfricaSouth AsiaSouth Asia (IDA & IBRD)SpainSri LankaSt. Kitts and NevisSt. LuciaSt. Vincent and the GrenadinesSub-Saharan Africa Sub-Saharan Africa (excluding high income)Sub-Saharan Africa (IDA & IBRD countries)SudanSurinameSwazilandSwedenSwitzerlandSyrian Arab RepublicTajikistanTanzaniaThailandTimor-LesteTogoTongaTrinidad and TobagoTunisiaTurkeyTurkmenistanTurks and Caicos IslandsTuvaluUgandaUkraineUnited Arab EmiratesUnited KingdomUnited StatesUpper middle incomeUruguayVanuatuVenezuela, RBVietnamVirgin Islands (U.S.)WorldYemen, Rep.ZambiaZimbabwe Timeline:
This timeline shows a graph from 1971 to 2016 of Uruguay. No data until 1970. Number of actual observations by date: 45.
Source name:
World Development Indicators
Source organization:
World Bank staff estimates from the Comtrade database maintained by the United Nations Statistics Division.
Categories, topics:
Private Sector, Trade
Last updated:
apr 23, 2017
Indicators value changes by year
Maximum:
66.741
jan 1, 2014
At the date of observation
Value
Absolute change
Change from previous value
jan 1, 1971
48.06
+48.06
0.0%
jan 1, 1972
47.763
-0.297
-0.62%
jan 1, 1973
54.823
+7.06
14.78%
jan 1, 1975
52.814
-2.009
-3.66%
jan 1, 1976
43.837
-8.977
-17.0%
jan 1, 1977
44.456
+0.62
1.41%
jan 1, 1978
37.899
-6.557
-14.75%
jan 1, 1979
35.215
-2.684
-7.08%
jan 1, 1980
36.507
+1.292
3.67%
jan 1, 1981
39.139
+2.632
7.21%
jan 1, 1982
47.445
+8.306
21.22%
jan 1, 1983
44.723
-2.722
-5.74%
jan 1, 1984
50.988
+6.265
14.01%
jan 1, 1985
41.431
-9.557
-18.74%
jan 1, 1986
42.348
+0.917
2.21%
jan 1, 1987
42.505
+0.157
0.37%
jan 1, 1988
32.26
-10.245
-24.1%
jan 1, 1989
33.119
+0.859
2.66%
jan 1, 1990
37.283
+4.164
12.57%
jan 1, 1991
39.516
+2.233
5.99%
jan 1, 1992
40.636
+1.12
2.83%
jan 1, 1993
38.71
-1.926
-4.74%
jan 1, 1994
40.661
+1.951
5.04%
jan 1, 1995
41.067
+0.406
1.0%
jan 1, 1996
44.306
+3.239
7.89%
jan 1, 1997
46.822
+2.516
5.68%
jan 1, 1998
48.592
+1.769
3.78%
jan 1, 1999
51.05
+2.459
5.06%
jan 1, 2000
51.287
+0.236
0.46%
jan 1, 2001
46.678
-4.609
-8.99%
jan 1, 2002
44.54
-2.137
-4.58%
jan 1, 2003
49.148
+4.608
10.35%
jan 1, 2004
52.959
+3.811
7.75%
jan 1, 2005
54.738
+1.779
3.36%
jan 1, 2006
55.227
+0.489
0.89%
jan 1, 2007
55.787
+0.56
1.01%
jan 1, 2008
53.962
-1.825
-3.27%
jan 1, 2009
59.457
+5.495
10.18%
jan 1, 2010
64.233
+4.775
8.03%
jan 1, 2011
61.926
-2.306
-3.59%
jan 1, 2012
62.317
+0.391
0.63%
jan 1, 2013
66.087
+3.77
6.05%
jan 1, 2014
66.741
+0.653
0.99%
jan 1, 2015
65.293
-1.448
-2.17%
jan 1, 2016
61.488
-3.805
-5.83%
Ranking of countries by current statistics by years


Comments: