29
/
en
AIzaSyAYiBZKx7MnpbEhh9jyipgxe19OcubqV5w
April 1, 2024
167469
Kenya
KEN
true
2
1
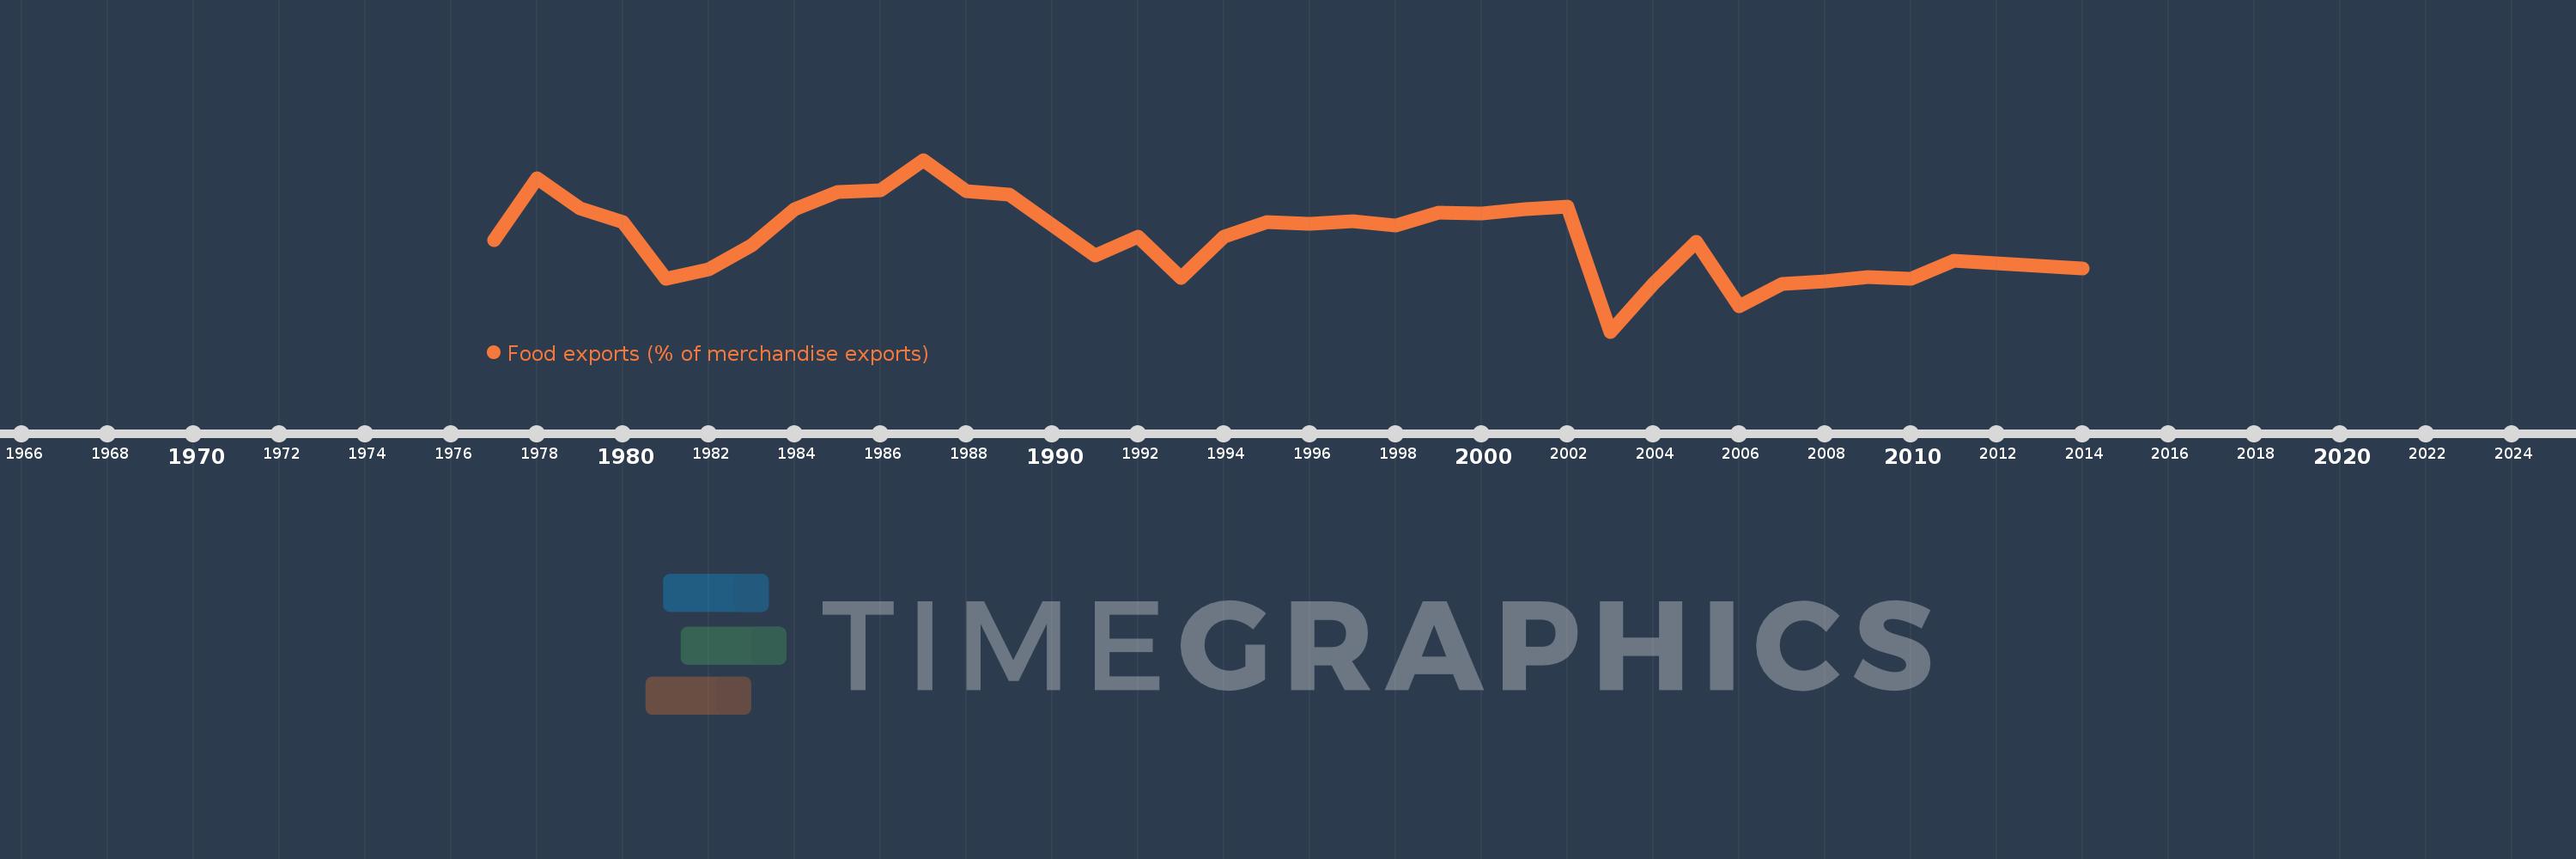
Food exports (% of merchandise exports)
2014,2011,2010,2009,2008,2007,2006,2005,2004,2003,2002,2001,2000,1999,1998,1997,1996,1995,1994,1993,1992,1991,1989,1988,1987,1986,1985,1984,1983,1982,1981,1980,1979,1978,1977
This statistics in other country:
AfghanistanAlbaniaAlgeriaAndorraAngolaAntigua and BarbudaArab WorldArgentinaArmeniaArubaAustraliaAustriaAzerbaijanBahamas, TheBahrainBangladeshBarbadosBelarusBelgiumBelizeBeninBermudaBhutanBoliviaBosnia and HerzegovinaBotswanaBrazilBrunei DarussalamBulgariaBurkina FasoBurundiCabo VerdeCambodiaCameroonCanadaCaribbean small statesCayman IslandsCentral African RepublicCentral Europe and the BalticsChadChileChinaColombiaComorosCongo, Dem. Rep.Congo, Rep.Costa RicaCote d'IvoireCroatiaCubaCyprusCzech RepublicDenmarkDjiboutiDominicaDominican RepublicEarly-demographic dividendEast Asia & PacificEast Asia & Pacific (excluding high income)East Asia & Pacific (IDA & IBRD countries)EcuadorEgypt, Arab Rep.El SalvadorEquatorial GuineaEritreaEstoniaEthiopiaEuro areaEurope & Central AsiaEurope & Central Asia (excluding high income)Europe & Central Asia (IDA & IBRD countries)European UnionFaroe IslandsFijiFinlandFragile and conflict affected situationsFranceFrench PolynesiaGabonGambia, TheGeorgiaGermanyGhanaGreeceGreenlandGrenadaGuatemalaGuineaGuinea-BissauGuyanaHaitiHeavily indebted poor countries (HIPC)High incomeHondurasHong Kong SAR, ChinaHungaryIBRD onlyIcelandIDA & IBRD totalIDA blendIDA onlyIDA totalIndiaIndonesiaIran, Islamic Rep.IraqIrelandIsraelItalyJamaicaJapanJordanKazakhstanKenyaKiribatiKorea, Rep.KuwaitKyrgyz RepublicLao PDRLate-demographic dividendLatin America & Caribbean Latin America & Caribbean (excluding high income)Latin America & the Caribbean (IDA & IBRD countries)LatviaLeast developed countries: UN classificationLebanonLesothoLiberiaLibyaLithuaniaLow & middle incomeLower middle incomeLuxembourgMacao SAR, ChinaMacedonia, FYRMadagascarMalawiMalaysiaMaldivesMaliMaltaMauritaniaMauritiusMexicoMiddle East & North AfricaMiddle East & North Africa (excluding high income)Middle East & North Africa (IDA & IBRD countries)Middle incomeMoldovaMongoliaMoroccoMozambiqueMyanmarNamibiaNepalNetherlandsNew CaledoniaNew ZealandNicaraguaNigerNigeriaNorth AmericaNorwayOECD membersOmanOther small statesPacific island small statesPakistanPalauPanamaPapua New GuineaParaguayPeruPhilippinesPolandPortugalPost-demographic dividendPre-demographic dividendQatarRomaniaRussian FederationRwandaSamoaSao Tome and PrincipeSaudi ArabiaSenegalSerbiaSeychellesSierra LeoneSingaporeSlovak RepublicSloveniaSmall statesSolomon IslandsSomaliaSouth AfricaSouth AsiaSouth Asia (IDA & IBRD)SpainSri LankaSt. Kitts and NevisSt. LuciaSt. Vincent and the GrenadinesSub-Saharan Africa Sub-Saharan Africa (excluding high income)Sub-Saharan Africa (IDA & IBRD countries)SudanSurinameSwazilandSwedenSwitzerlandSyrian Arab RepublicTajikistanTanzaniaThailandTimor-LesteTogoTongaTrinidad and TobagoTunisiaTurkeyTurkmenistanTurks and Caicos IslandsTuvaluUgandaUkraineUnited Arab EmiratesUnited KingdomUnited StatesUpper middle incomeUruguayVanuatuVenezuela, RBVietnamVirgin Islands (U.S.)WorldYemen, Rep.ZambiaZimbabwe Timeline:
This timeline shows a graph from 1977 to 2014 of Kenya. No data until 1976. Number of actual observations by date: 35.
Source name:
World Development Indicators
Source organization:
World Bank staff estimates from the Comtrade database maintained by the United Nations Statistics Division.
Categories, topics:
Private Sector, Trade
Last updated:
apr 23, 2017
Indicators value changes by year
Minimum:
32.148
jan 1, 2003
Maximum:
70.315
jan 1, 1987
At the date of observation
Value
Absolute change
Change from previous value
jan 1, 1977
52.382
+52.382
0.0%
jan 1, 1978
66.153
+13.771
26.29%
jan 1, 1979
59.552
-6.601
-9.98%
jan 1, 1980
56.531
-3.021
-5.07%
jan 1, 1981
43.847
-12.684
-22.44%
jan 1, 1982
45.939
+2.092
4.77%
jan 1, 1983
51.395
+5.456
11.88%
jan 1, 1984
59.435
+8.039
15.64%
jan 1, 1985
63.238
+3.804
6.4%
jan 1, 1986
63.575
+0.337
0.53%
jan 1, 1987
70.315
+6.74
10.6%
jan 1, 1988
63.313
-7.002
-9.96%
jan 1, 1989
62.512
-0.801
-1.26%
jan 1, 1991
49.129
-13.383
-21.41%
jan 1, 1992
53.227
+4.098
8.34%
jan 1, 1993
44.157
-9.07
-17.04%
jan 1, 1994
53.253
+9.096
20.6%
jan 1, 1995
56.455
+3.203
6.01%
jan 1, 1996
56.088
-0.368
-0.65%
jan 1, 1997
56.71
+0.623
1.11%
jan 1, 1998
55.638
-1.072
-1.89%
jan 1, 1999
58.547
+2.908
5.23%
jan 1, 2000
58.422
-0.125
-0.21%
jan 1, 2001
59.277
+0.855
1.46%
jan 1, 2002
60.0
+0.724
1.22%
jan 1, 2003
32.148
-27.852
-46.42%
jan 1, 2004
42.683
+10.535
32.77%
jan 1, 2005
52.024
+9.341
21.88%
jan 1, 2006
37.72
-14.305
-27.5%
jan 1, 2007
42.661
+4.941
13.1%
jan 1, 2008
43.32
+0.659
1.54%
jan 1, 2009
44.21
+0.89
2.06%
jan 1, 2010
43.976
-0.234
-0.53%
jan 1, 2011
47.92
+3.943
8.97%
jan 1, 2014
46.222
-1.697
-3.54%
Ranking of countries by current statistics by years


Comments: