29
/
en
AIzaSyAYiBZKx7MnpbEhh9jyipgxe19OcubqV5w
April 1, 2024
234617
Saudi Arabia
SAU
true
2
1
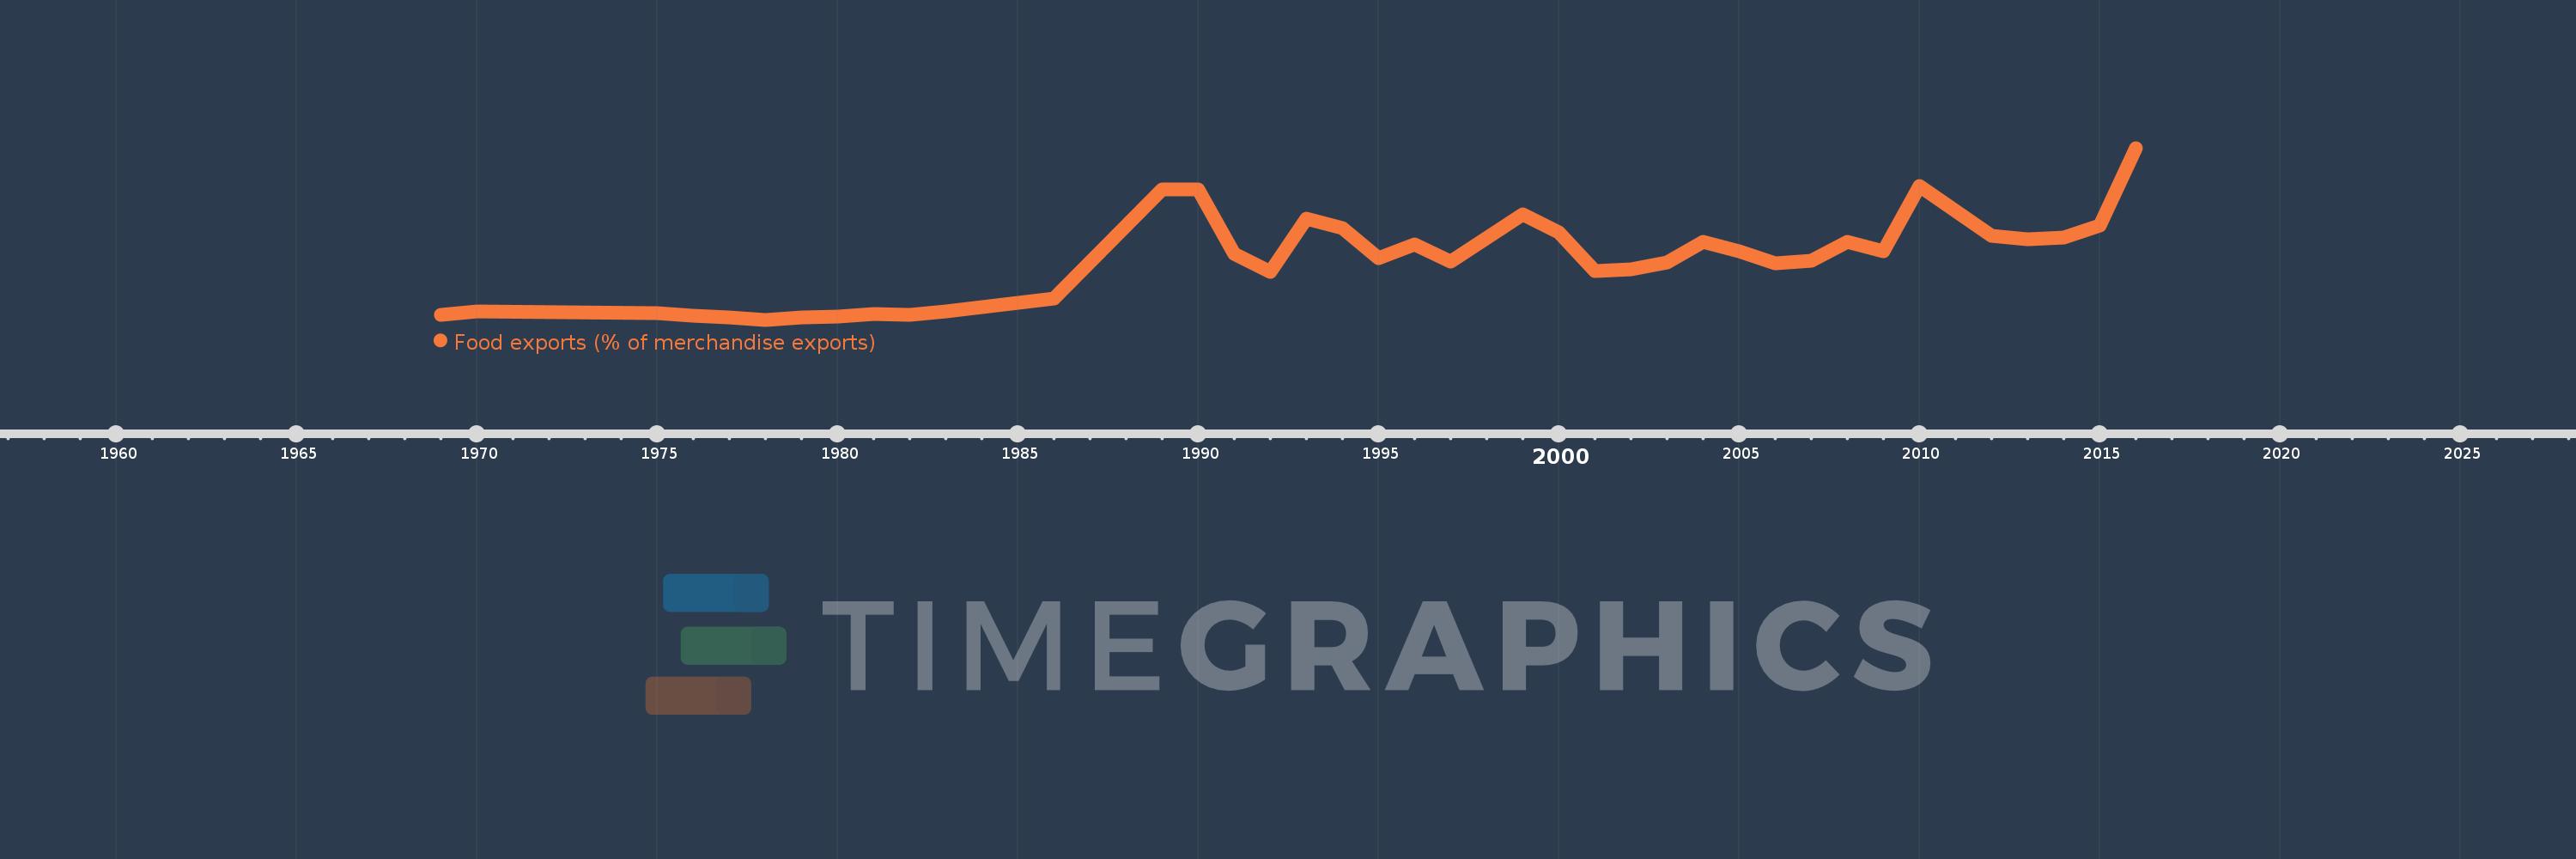
Food exports (% of merchandise exports)
2016,2015,2014,2013,2012,2011,2010,2009,2008,2007,2006,2005,2004,2003,2002,2001,2000,1999,1997,1996,1995,1994,1993,1992,1991,1990,1989,1986,1983,1982,1981,1980,1979,1978,1977,1976,1975,1970,1969
This statistics in other country:
AfghanistanAlbaniaAlgeriaAndorraAngolaAntigua and BarbudaArab WorldArgentinaArmeniaArubaAustraliaAustriaAzerbaijanBahamas, TheBahrainBangladeshBarbadosBelarusBelgiumBelizeBeninBermudaBhutanBoliviaBosnia and HerzegovinaBotswanaBrazilBrunei DarussalamBulgariaBurkina FasoBurundiCabo VerdeCambodiaCameroonCanadaCaribbean small statesCayman IslandsCentral African RepublicCentral Europe and the BalticsChadChileChinaColombiaComorosCongo, Dem. Rep.Congo, Rep.Costa RicaCote d'IvoireCroatiaCubaCyprusCzech RepublicDenmarkDjiboutiDominicaDominican RepublicEarly-demographic dividendEast Asia & PacificEast Asia & Pacific (excluding high income)East Asia & Pacific (IDA & IBRD countries)EcuadorEgypt, Arab Rep.El SalvadorEquatorial GuineaEritreaEstoniaEthiopiaEuro areaEurope & Central AsiaEurope & Central Asia (excluding high income)Europe & Central Asia (IDA & IBRD countries)European UnionFaroe IslandsFijiFinlandFragile and conflict affected situationsFranceFrench PolynesiaGabonGambia, TheGeorgiaGermanyGhanaGreeceGreenlandGrenadaGuatemalaGuineaGuinea-BissauGuyanaHaitiHeavily indebted poor countries (HIPC)High incomeHondurasHong Kong SAR, ChinaHungaryIBRD onlyIcelandIDA & IBRD totalIDA blendIDA onlyIDA totalIndiaIndonesiaIran, Islamic Rep.IraqIrelandIsraelItalyJamaicaJapanJordanKazakhstanKenyaKiribatiKorea, Rep.KuwaitKyrgyz RepublicLao PDRLate-demographic dividendLatin America & Caribbean Latin America & Caribbean (excluding high income)Latin America & the Caribbean (IDA & IBRD countries)LatviaLeast developed countries: UN classificationLebanonLesothoLiberiaLibyaLithuaniaLow & middle incomeLower middle incomeLuxembourgMacao SAR, ChinaMacedonia, FYRMadagascarMalawiMalaysiaMaldivesMaliMaltaMauritaniaMauritiusMexicoMiddle East & North AfricaMiddle East & North Africa (excluding high income)Middle East & North Africa (IDA & IBRD countries)Middle incomeMoldovaMongoliaMoroccoMozambiqueMyanmarNamibiaNepalNetherlandsNew CaledoniaNew ZealandNicaraguaNigerNigeriaNorth AmericaNorwayOECD membersOmanOther small statesPacific island small statesPakistanPalauPanamaPapua New GuineaParaguayPeruPhilippinesPolandPortugalPost-demographic dividendPre-demographic dividendQatarRomaniaRussian FederationRwandaSamoaSao Tome and PrincipeSaudi ArabiaSenegalSerbiaSeychellesSierra LeoneSingaporeSlovak RepublicSloveniaSmall statesSolomon IslandsSomaliaSouth AfricaSouth AsiaSouth Asia (IDA & IBRD)SpainSri LankaSt. Kitts and NevisSt. LuciaSt. Vincent and the GrenadinesSub-Saharan Africa Sub-Saharan Africa (excluding high income)Sub-Saharan Africa (IDA & IBRD countries)SudanSurinameSwazilandSwedenSwitzerlandSyrian Arab RepublicTajikistanTanzaniaThailandTimor-LesteTogoTongaTrinidad and TobagoTunisiaTurkeyTurkmenistanTurks and Caicos IslandsTuvaluUgandaUkraineUnited Arab EmiratesUnited KingdomUnited StatesUpper middle incomeUruguayVanuatuVenezuela, RBVietnamVirgin Islands (U.S.)WorldYemen, Rep.ZambiaZimbabwe Timeline:
This timeline shows a graph from 1969 to 2016 of Saudi Arabia. No data until 1968. Number of actual observations by date: 39.
Source name:
World Development Indicators
Source organization:
World Bank staff estimates from the Comtrade database maintained by the United Nations Statistics Division.
Categories, topics:
Private Sector, Trade
Last updated:
apr 23, 2017
Indicators value changes by year
At the date of observation
Value
Absolute change
Change from previous value
jan 1, 1969
0.089
+0.089
0.0%
jan 1, 1970
0.124
+0.036
40.17%
jan 1, 1975
0.11
-0.015
-11.92%
jan 1, 1976
0.085
-0.024
-22.01%
jan 1, 1977
0.062
-0.024
-27.67%
jan 1, 1978
0.041
-0.021
-33.25%
jan 1, 1979
0.061
+0.02
47.49%
jan 1, 1980
0.072
+0.011
17.87%
jan 1, 1981
0.096
+0.025
34.34%
jan 1, 1982
0.094
-0.002
-2.39%
jan 1, 1983
0.128
+0.034
36.58%
jan 1, 1986
0.26
+0.131
102.19%
jan 1, 1989
1.371
+1.111
427.77%
jan 1, 1990
1.375
+0.004
0.28%
jan 1, 1991
0.713
-0.662
-48.13%
jan 1, 1992
0.526
-0.187
-26.19%
jan 1, 1993
1.074
+0.548
104.11%
jan 1, 1994
0.982
-0.092
-8.57%
jan 1, 1995
0.674
-0.308
-31.39%
jan 1, 1996
0.81
+0.136
20.22%
jan 1, 1997
0.632
-0.178
-21.96%
jan 1, 1999
1.115
+0.482
76.3%
jan 1, 2000
0.931
-0.184
-16.49%
jan 1, 2001
0.539
-0.392
-42.16%
jan 1, 2002
0.558
+0.02
3.71%
jan 1, 2003
0.629
+0.07
12.55%
jan 1, 2004
0.836
+0.207
32.98%
jan 1, 2005
0.741
-0.095
-11.41%
jan 1, 2006
0.621
-0.12
-16.16%
jan 1, 2007
0.642
+0.021
3.42%
jan 1, 2008
0.839
+0.197
30.67%
jan 1, 2009
0.744
-0.095
-11.31%
jan 1, 2010
1.408
+0.664
89.19%
jan 1, 2011
1.156
-0.252
-17.89%
jan 1, 2012
0.898
-0.258
-22.28%
jan 1, 2013
0.861
-0.038
-4.19%
jan 1, 2014
0.879
+0.018
2.13%
jan 1, 2015
1.006
+0.127
14.49%
jan 1, 2016
1.798
+0.792
78.69%
Ranking of countries by current statistics by years


Comments: